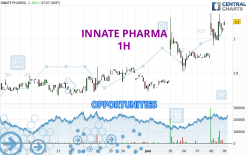
Londinia Opportunities Analyses - 06/09/2023 (GMT) INNATE PHARMA - 1H
-
EUR
(-)
-
15 min delayed data - Euronext Paris
| Type: | Stocks |
| Ticker: | IPH |
| ISIN: | FR0010331421 |
I am delighted to see that my first price objective has been achieved. I hope you've taken advantage of it.
- Europe Stocks
- Timeframe : 1H
- - Analysis generated on
- Status : TARGET REACHED
Summary of the analysis
Trends
Short term:
Strongly bullish
Underlying:
Strongly bullish
Technical indicators
78%
6%
17%
My opinion
Bullish above 3.075 EUR
My targets
3.125 EUR (+0.81%)
3.264 EUR (+5.29%)
My analysis
All elements being clearly bullish, it would be possible for traders to trade only long positions (at the time of purchase) on INNATE PHARMA as long as the price remains well above 3.075 EUR. The buyers' bullish objective is set at 3.125 EUR. A bullish break in this resistance would boost the bullish momentum. The buyers could then target the resistance located at 3.264 EUR. If there is any crossing, the next objective would be the resistance located at 3.418 EUR. However, beware of bullish excesses that could lead to a possible short-term correction; but this possible correction would not be tradeable.
In the very short term, the general bullish sentiment is confirmed by technical indicators. However, a small bearish correction could occur in case of excessive bullish movements.
Force
0
10
8.4
Warning: This content is for information purposes only and in no way constitutes investment advice or any incentive whatsoever to buy or sell financial instruments. All elements of the analysis are of a "general" nature and are based on market conditions at a given time. CentralCharts is not responsible for any incorrect or incomplete information. Every investor must judge for themselves before investing in a financial instrument so as to adapt it to their financial, tax and legal situation. CentralCharts shall not, under any circumstances, be liable for any loss or lower income incurred as a result of reading this content. Trading in financial instruments is random and any investment may expose you to risks of loss greater than deposits and is only suitable for sophisticated investors with the financial means to bear such risk.
Additional analysis
Quotes
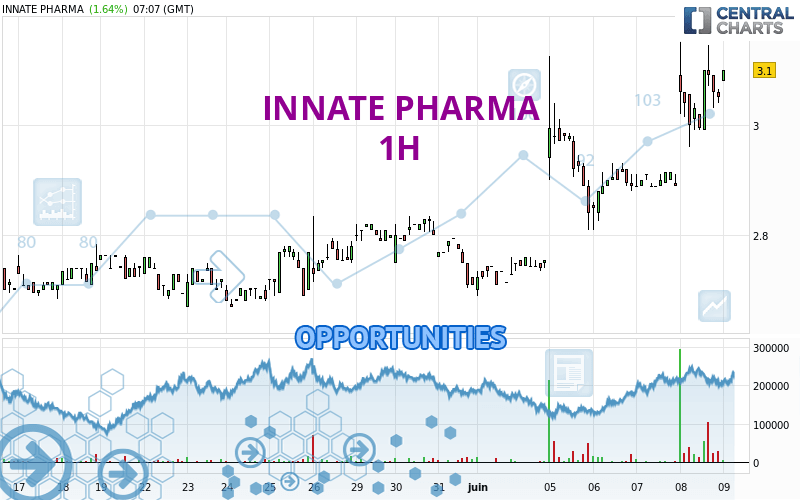
INNATE PHARMA rating 3.100 EUR. The price registered an increase of +1.64% on the session with the lowest point at 3.080 EUR and the highest point at 3.100 EUR. The deviation from the price is +0.65% for the low point and 0% for the high point.3.080
3.100
3.100
A bullish opening was detected by the Central Gaps scanner. Buyers are trying to impose a bullish momentum in the very short term.
Bullish opening
Type : Bullish
Timeframe : Openning
So that you have an overall view of the price change, here is a table showing the variations over several periods:
Technical
A technical analysis in 1H of this INNATE PHARMA chart shows a strongly bullish trend. 92.86% of the signals given by moving averages are bullish. This strongly bullish trend is supported by the strong bullish signals given by short-term moving averages. The Central Indicators scanner does not detect any result on moving averages that would impact this trend.
An assessment of technical indicators shows a strong bullish signal.
The Central Indicators scanner specialised in technical indicators, has not detected anything further.
The analysis of the price chart with Central Patterns scanners does not return any result.
No result was found by the Central Candlesticks scanner on Japanese candlesticks.
ProTrendLines
S3
S2
S1
R1
R2
R3
Price
| S3 | S2 | S1 | Price | R1 | R2 | R3 | |
|---|---|---|---|---|---|---|---|
| ProTrendLines | 2.799 | 2.960 | 3.075 | 3.100 | 3.125 | 3.264 | 3.418 |
| Change (%) | -9.71% | -4.52% | -0.81% | - | +0.81% | +5.29% | +10.26% |
| Change | -0.301 | -0.140 | -0.025 | - | +0.025 | +0.164 | +0.318 |
| Level | Major | Minor | Major | - | Intermediate | Minor | Minor |
Attention could also be paid to pivot points to set price objectives:
Daily
| Pivot points | S3 | S2 | S1 | PP | R1 | R2 | R3 |
|---|---|---|---|---|---|---|---|
| Standard | 2.767 | 2.863 | 2.957 | 3.053 | 3.147 | 3.243 | 3.337 |
| Camarilla | 2.998 | 3.015 | 3.033 | 3.050 | 3.067 | 3.085 | 3.102 |
| Woodie | 2.765 | 2.863 | 2.955 | 3.053 | 3.145 | 3.243 | 3.335 |
| Fibonacci | 2.863 | 2.936 | 2.981 | 3.053 | 3.126 | 3.171 | 3.243 |
Weekly
| Pivot points | S3 | S2 | S1 | PP | R1 | R2 | R3 |
|---|---|---|---|---|---|---|---|
| Standard | 2.540 | 2.615 | 2.685 | 2.760 | 2.830 | 2.905 | 2.975 |
| Camarilla | 2.715 | 2.728 | 2.742 | 2.755 | 2.768 | 2.782 | 2.795 |
| Woodie | 2.538 | 2.614 | 2.683 | 2.759 | 2.828 | 2.904 | 2.973 |
| Fibonacci | 2.615 | 2.670 | 2.705 | 2.760 | 2.815 | 2.850 | 2.905 |
Monthly
| Pivot points | S3 | S2 | S1 | PP | R1 | R2 | R3 |
|---|---|---|---|---|---|---|---|
| Standard | 2.093 | 2.317 | 2.513 | 2.737 | 2.933 | 3.157 | 3.353 |
| Camarilla | 2.595 | 2.633 | 2.672 | 2.710 | 2.749 | 2.787 | 2.826 |
| Woodie | 2.080 | 2.310 | 2.500 | 2.730 | 2.920 | 3.150 | 3.340 |
| Fibonacci | 2.317 | 2.477 | 2.576 | 2.737 | 2.897 | 2.996 | 3.157 |
Numerical data
The following are the details of the technical indicators and moving averages that were collected to generate this technical analysis:
Technical indicators
Moving averages
| RSI (14): | 61.04 | |
| MACD (12,26,9): | 0.0510 | |
| Directional Movement: | 24.425 | |
| AROON (14): | 42.857 | |
| DEMA (21): | 3.050 | |
| Parabolic SAR (0,02-0,02-0,2): | 2.950 | |
| Elder Ray (13): | 0.039 | |
| Super Trend (3,10): | 2.939 | |
| Zig ZAG (10): | 3.050 | |
| VORTEX (21): | 0.9750 | |
| Stochastique (14,3,5): | 67.95 | |
| TEMA (21): | 3.071 | |
| Williams %R (14): | -38.46 | |
| Chande Momentum Oscillator (20): | 0.150 | |
| Repulse (5,40,3): | -0.0610 | |
| ROCnROLL: | 1 | |
| TRIX (15,9): | 0.2070 | |
| Courbe Coppock: | 10.37 |
| MA7: | 2.836 | |
| MA20: | 2.770 | |
| MA50: | 2.788 | |
| MA100: | 2.921 | |
| MAexp7: | 3.044 | |
| MAexp20: | 2.986 | |
| MAexp50: | 2.913 | |
| MAexp100: | 2.852 | |
| Price / MA7: | +9.31% | |
| Price / MA20: | +11.91% | |
| Price / MA50: | +11.19% | |
| Price / MA100: | +6.13% | |
| Price / MAexp7: | +1.84% | |
| Price / MAexp20: | +3.82% | |
| Price / MAexp50: | +6.42% | |
| Price / MAexp100: | +8.70% |
Quotes :
-
15 min delayed data
-
Euronext Paris
News
Don't forget to follow the news on INNATE PHARMA. At the time of publication of this analysis, the latest news was as follows:
- SAR’579 / IPH6101 Receives FDA Fast Track Designation in the US for the Treatment of Hematological Malignancies
- Innate Pharma: SAR’579 / IPH6101 Receives FDA Fast Track Designation in the US for the Treatment of Hematological Malignancies
- Number of Shares and Voting Rights of Innate Pharma as of June 1, 2023
- Number of Shares and Voting Rights of Innate Pharma as of June 1, 2023
- Innate Pharma Highlights Phase 1/2 Dose Escalation Safety and Preliminary Efficacy of Sanofi Developed First NK Cell Engager SAR’579 / IPH6101 in R/R AML