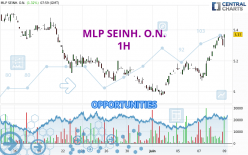
Londinia Opportunities Analyses - 06/09/2023 (GMT) MLP SEINH. O.N. - 1H
-
EUR
(-)
-
15 min delayed data - Germany Stocks
| Type: | Stocks |
| Ticker: | MLP |
| ISIN: | DE0006569908 |
- Europe Stocks
- Timeframe : 1H
- - Analysis generated on
- Status : INVALID
Summary of the analysis
Trends
Short term:
Strongly bullish
Underlying:
Strongly bullish
Technical indicators
78%
0%
22%
My opinion
Bullish above 5.340 EUR
My targets
5.400 EUR (+0.56%)
5.450 EUR (+1.49%)
My analysis
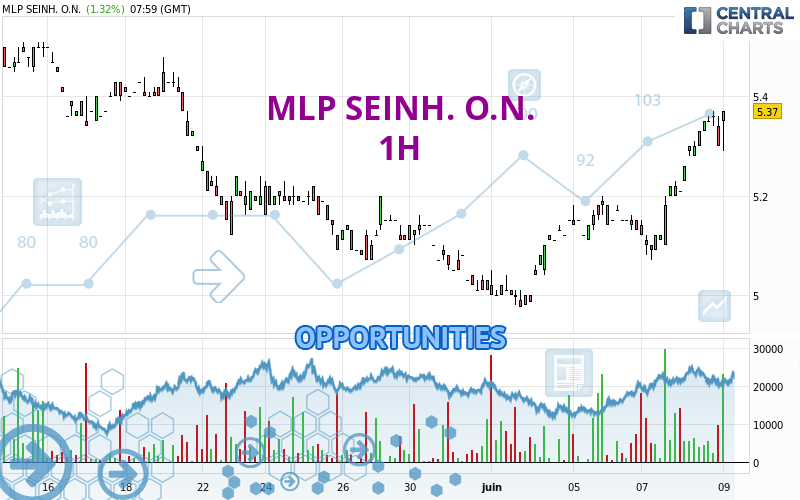
The bullish trend is currently very strong on MLP SEINH. O.N.. As long as the price remains above the support at 5.340 EUR, you could try to benefit from the boom. The first bullish objective is located at 5.400 EUR. The bullish momentum would be boosted by a break in this resistance. Buyers would then use the next resistance located at 5.450 EUR as an objective. Crossing it would then enable buyers to target 5.522 EUR. Be careful, given the powerful bullish rally underway, excesses could lead to a possible correction in the short term. If this is the case, remember that trading against the trend may be riskier. It would seem more appropriate to wait for a signal indicating reversal of the trend.
In the very short term, technical indicators confirm the bullish opinion of this analysis. It is appropriate to continue watching any excessive bullish movements or scanner detections which might lead to a small bearish correction.
Force
0
10
8.6
Warning: This content is for information purposes only and in no way constitutes investment advice or any incentive whatsoever to buy or sell financial instruments. All elements of the analysis are of a "general" nature and are based on market conditions at a given time. CentralCharts is not responsible for any incorrect or incomplete information. Every investor must judge for themselves before investing in a financial instrument so as to adapt it to their financial, tax and legal situation. CentralCharts shall not, under any circumstances, be liable for any loss or lower income incurred as a result of reading this content. Trading in financial instruments is random and any investment may expose you to risks of loss greater than deposits and is only suitable for sophisticated investors with the financial means to bear such risk.
Additional analysis
Quotes
The MLP SEINH. O.N. rating is 5.370 EUR. On the day, this instrument gained +1.32% and was traded between 5.290 EUR and 5.370 EUR over the period. The price is currently at +1.51% from its lowest and 0% from its highest.5.290
5.370
5.370
The Central Gaps scanner detects a bullish opening marking the presence of buyers ahead of sellers at the opening but not sufficiently marked to allow the price to register a quotation gap.
Bullish opening
Type : Bullish
Timeframe : Openning
Here is a more detailed summary of the historical variations registered by MLP SEINH. O.N.:
Near a new HIGH record (1 month)
Type : Bullish
Timeframe : Weekly
Technical
A technical analysis in 1H of this MLP SEINH. O.N. chart shows a strongly bullish trend. The signals given by the moving averages are 92.86% bullish. This strong bullish trend is confirmed by the strong signals currently being given by short-term moving averages. There is no crossing of moving average by the price or crossing of moving averages between themselves.
In fact, according to the parameters integrated into the Central Analyzer system, 14 technical indicators out of 18 analysed are currently bullish. Central Indicators, the scanner specialised in technical indicators, has identified this signal:
Pivot points : price is over resistance 1
Type : Neutral
Timeframe : Weekly
Central Patterns, the scanner specializing in chart patterns, did not identify any signals.
No result was found by the Central Candlesticks scanner on Japanese candlesticks.
ProTrendLines
S3
S2
S1
R1
R2
R3
Price
| S3 | S2 | S1 | Price | R1 | R2 | R3 | |
|---|---|---|---|---|---|---|---|
| ProTrendLines | 5.200 | 5.290 | 5.340 | 5.370 | 5.400 | 5.450 | 5.522 |
| Change (%) | -3.17% | -1.49% | -0.56% | - | +0.56% | +1.49% | +2.83% |
| Change | -0.170 | -0.080 | -0.030 | - | +0.030 | +0.080 | +0.152 |
| Level | Intermediate | Minor | Intermediate | - | Intermediate | Minor | Major |
Attention could also be paid to pivot points to set price objectives:
Daily
| Pivot points | S3 | S2 | S1 | PP | R1 | R2 | R3 |
|---|---|---|---|---|---|---|---|
| Standard | 5.090 | 5.160 | 5.230 | 5.300 | 5.370 | 5.440 | 5.510 |
| Camarilla | 5.262 | 5.274 | 5.287 | 5.300 | 5.313 | 5.326 | 5.339 |
| Woodie | 5.090 | 5.160 | 5.230 | 5.300 | 5.370 | 5.440 | 5.510 |
| Fibonacci | 5.160 | 5.214 | 5.247 | 5.300 | 5.354 | 5.387 | 5.440 |
Weekly
| Pivot points | S3 | S2 | S1 | PP | R1 | R2 | R3 |
|---|---|---|---|---|---|---|---|
| Standard | 4.792 | 4.883 | 5.017 | 5.108 | 5.242 | 5.333 | 5.467 |
| Camarilla | 5.088 | 5.109 | 5.129 | 5.150 | 5.171 | 5.191 | 5.212 |
| Woodie | 4.813 | 4.894 | 5.038 | 5.119 | 5.263 | 5.344 | 5.488 |
| Fibonacci | 4.883 | 4.969 | 5.022 | 5.108 | 5.194 | 5.247 | 5.333 |
Monthly
| Pivot points | S3 | S2 | S1 | PP | R1 | R2 | R3 |
|---|---|---|---|---|---|---|---|
| Standard | 4.357 | 4.683 | 4.857 | 5.183 | 5.357 | 5.683 | 5.857 |
| Camarilla | 4.893 | 4.938 | 4.984 | 5.030 | 5.076 | 5.122 | 5.168 |
| Woodie | 4.280 | 4.645 | 4.780 | 5.145 | 5.280 | 5.645 | 5.780 |
| Fibonacci | 4.683 | 4.874 | 4.992 | 5.183 | 5.374 | 5.492 | 5.683 |
Numerical data
The following are the details of the technical indicators and moving averages that were collected to generate this technical analysis:
Technical indicators
Moving averages
| RSI (14): | 63.60 | |
| MACD (12,26,9): | 0.0550 | |
| Directional Movement: | 22.121 | |
| AROON (14): | 85.714 | |
| DEMA (21): | 5.325 | |
| Parabolic SAR (0,02-0,02-0,2): | 5.281 | |
| Elder Ray (13): | 0.035 | |
| Super Trend (3,10): | 5.265 | |
| Zig ZAG (10): | 5.330 | |
| VORTEX (21): | 1.1000 | |
| Stochastique (14,3,5): | 85.62 | |
| TEMA (21): | 5.355 | |
| Williams %R (14): | -14.82 | |
| Chande Momentum Oscillator (20): | 0.170 | |
| Repulse (5,40,3): | 0.2390 | |
| ROCnROLL: | 1 | |
| TRIX (15,9): | 0.1350 | |
| Courbe Coppock: | 7.66 |
| MA7: | 5.191 | |
| MA20: | 5.211 | |
| MA50: | 5.121 | |
| MA100: | 5.104 | |
| MAexp7: | 5.327 | |
| MAexp20: | 5.251 | |
| MAexp50: | 5.188 | |
| MAexp100: | 5.177 | |
| Price / MA7: | +3.45% | |
| Price / MA20: | +3.05% | |
| Price / MA50: | +4.86% | |
| Price / MA100: | +5.21% | |
| Price / MAexp7: | +0.81% | |
| Price / MAexp20: | +2.27% | |
| Price / MAexp50: | +3.51% | |
| Price / MAexp100: | +3.73% |
Quotes :
-
15 min delayed data
-
Actions Allemagne
News
Don't forget to follow the news on MLP SEINH. O.N.. At the time of publication of this analysis, the latest news was as follows:
- EQS-News: MLP SE: Invitation to the Annual General Meeting of MLP SE published
- EQS-News: MLP SE: Q1: MLP remains on course
- EQS-News: MLP SE: FY 2022: MLP defies difficult environment – 2025 growth course reaffirmed
- EQS-News: MLP SE: 9M: On course for continued growth thanks to diversified basis
- DGAP-News: MLP SE: H1: MLP Group remains on track