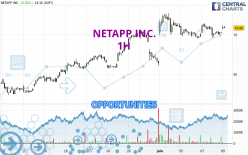
Londinia Opportunities Analyses - 06/09/2023 (GMT) NETAPP INC. - 1H
- U.S. Stocks
- Timeframe : 1H
- - Analysis generated on
- Status : INVALID
Summary of the analysis
Trends
Short term:
Strongly bullish
Underlying:
Strongly bullish
Technical indicators
78%
0%
22%
My opinion
Bullish above 70.62 USD
My targets
71.96 USD (+1.35%)
73.47 USD (+3.48%)
My analysis
All elements being clearly bullish, it would be possible for traders to trade only long positions (at the time of purchase) on NETAPP INC. as long as the price remains well above 70.62 USD. The buyers' bullish objective is set at 71.96 USD. A bullish break in this resistance would boost the bullish momentum. The buyers could then target the resistance located at 73.47 USD. If there is any crossing, the next objective would be the resistance located at 76.21 USD. However, beware of bullish excesses that could lead to a possible short-term correction; but this possible correction would not be tradeable.
In the very short term, the general bullish sentiment is confirmed by technical indicators. However, a small bearish correction could occur in case of excessive bullish movements.
Force
0
10
8.6

Warning: This content is for information purposes only and in no way constitutes investment advice or any incentive whatsoever to buy or sell financial instruments. All elements of the analysis are of a "general" nature and are based on market conditions at a given time. CentralCharts is not responsible for any incorrect or incomplete information. Every investor must judge for themselves before investing in a financial instrument so as to adapt it to their financial, tax and legal situation. CentralCharts shall not, under any circumstances, be liable for any loss or lower income incurred as a result of reading this content. Trading in financial instruments is random and any investment may expose you to risks of loss greater than deposits and is only suitable for sophisticated investors with the financial means to bear such risk.
Additional analysis
Quotes
The NETAPP INC. rating is 71.00 USD. On the day, this instrument gained +0.95% and was between 70.67 USD and 71.22 USD. This implies that the price is at +0.47% from its lowest and at -0.31% from its highest.70.67
71.22
71.00
The Central Gaps scanner detects a bullish opening. A small advantage for buyers in the very short term.
Bullish opening
Type : Bullish
Timeframe : Openning
Here is a more detailed summary of the historical variations registered by NETAPP INC.:
Near a new HIGH record (1st january)
Type : Bullish
Timeframe : Weekly
Near a new HIGH record (1 month)
Type : Bullish
Timeframe : Weekly
Technical
Technical analysis of NETAPP INC. in 1H shows a strongly overall bullish trend. The signals given by the moving averages are 92.86% bullish. This strong bullish trend is confirmed by the strong signals currently being given by short-term moving averages. The Central Indicators market scanner is currently detecting a bullish signal that could impact this trend:
Bullish trend reversal : adaptative moving average 20
Type : Bullish
Timeframe : 1 hour
Technical indicators are strongly bullish, suggesting that the price increase should continue.
Other results related to technical indicators were also found by the Central Indicators scanner:
Pivot points : price is over resistance 1
Type : Neutral
Timeframe : 1 hour
RSI indicator is back over 50
Type : Bullish
Timeframe : 1 hour
Williams %R indicator is back over -50
Type : Bullish
Timeframe : 1 hour
An analysis of the price chart with the Central Patterns scanner (detector of chart patterns and resistances and supports) shows a result that can have an impact on the price change:
Resistance of channel is broken
Type : Bullish
Timeframe : 1 hour
No result was found by the Central Candlesticks scanner on Japanese candlesticks.
ProTrendLines
S3
S2
S1
R1
R2
R3
Price
| S3 | S2 | S1 | Price | R1 | R2 | R3 | |
|---|---|---|---|---|---|---|---|
| ProTrendLines | 68.39 | 69.47 | 70.62 | 71.00 | 71.96 | 73.47 | 76.21 |
| Change (%) | -3.68% | -2.15% | -0.54% | - | +1.35% | +3.48% | +7.34% |
| Change | -2.61 | -1.53 | -0.38 | - | +0.96 | +2.47 | +5.21 |
| Level | Major | Intermediate | Minor | - | Major | Major | Major |
To determine price objectives, it is also possible to use the pivot points. Here is the price position in relation to pivot points:
Daily
| Pivot points | S3 | S2 | S1 | PP | R1 | R2 | R3 |
|---|---|---|---|---|---|---|---|
| Standard | 68.26 | 68.92 | 69.63 | 70.29 | 71.00 | 71.66 | 72.37 |
| Camarilla | 69.95 | 70.08 | 70.20 | 70.33 | 70.46 | 70.58 | 70.71 |
| Woodie | 68.28 | 68.93 | 69.65 | 70.30 | 71.02 | 71.67 | 72.39 |
| Fibonacci | 68.92 | 69.45 | 69.77 | 70.29 | 70.82 | 71.14 | 71.66 |
Weekly
| Pivot points | S3 | S2 | S1 | PP | R1 | R2 | R3 |
|---|---|---|---|---|---|---|---|
| Standard | 60.30 | 63.15 | 67.07 | 69.92 | 73.84 | 76.69 | 80.61 |
| Camarilla | 69.12 | 69.74 | 70.36 | 70.98 | 71.60 | 72.22 | 72.84 |
| Woodie | 60.83 | 63.42 | 67.60 | 70.19 | 74.37 | 76.96 | 81.14 |
| Fibonacci | 63.15 | 65.74 | 67.34 | 69.92 | 72.51 | 74.11 | 76.69 |
Monthly
| Pivot points | S3 | S2 | S1 | PP | R1 | R2 | R3 |
|---|---|---|---|---|---|---|---|
| Standard | 52.64 | 57.09 | 61.72 | 66.17 | 70.80 | 75.25 | 79.88 |
| Camarilla | 63.85 | 64.69 | 65.52 | 66.35 | 67.18 | 68.02 | 68.85 |
| Woodie | 52.73 | 57.14 | 61.81 | 66.22 | 70.89 | 75.30 | 79.97 |
| Fibonacci | 57.09 | 60.56 | 62.70 | 66.17 | 69.64 | 71.78 | 75.25 |
Numerical data
The following is the status of technical indicators and moving averages registered at the time this technical analysis was created:
Technical indicators
Moving averages
| RSI (14): | 57.41 | |
| MACD (12,26,9): | 0.0800 | |
| Directional Movement: | 4.73 | |
| AROON (14): | -35.72 | |
| DEMA (21): | 70.63 | |
| Parabolic SAR (0,02-0,02-0,2): | 71.22 | |
| Elder Ray (13): | 0.52 | |
| Super Trend (3,10): | 69.60 | |
| Zig ZAG (10): | 71.11 | |
| VORTEX (21): | 1.0600 | |
| Stochastique (14,3,5): | 62.07 | |
| TEMA (21): | 70.52 | |
| Williams %R (14): | -26.30 | |
| Chande Momentum Oscillator (20): | 0.19 | |
| Repulse (5,40,3): | 0.0100 | |
| ROCnROLL: | 1 | |
| TRIX (15,9): | 0.0100 | |
| Courbe Coppock: | 0.16 |
| MA7: | 70.80 | |
| MA20: | 67.96 | |
| MA50: | 65.57 | |
| MA100: | 64.97 | |
| MAexp7: | 70.61 | |
| MAexp20: | 70.52 | |
| MAexp50: | 70.12 | |
| MAexp100: | 68.99 | |
| Price / MA7: | +0.28% | |
| Price / MA20: | +4.47% | |
| Price / MA50: | +8.28% | |
| Price / MA100: | +9.28% | |
| Price / MAexp7: | +0.55% | |
| Price / MAexp20: | +0.68% | |
| Price / MAexp50: | +1.25% | |
| Price / MAexp100: | +2.91% |
Quotes :
-
15 min delayed data
-
Actions NASDAQ
News
The last news published on NETAPP INC. at the time of the generation of this analysis was as follows:
- NetApp Appoints Haiyan Song Executive Vice President and General Manager of CloudOps Business
- NetApp’s 2023 Cloud Complexity Report Highlights the Shifting Demands of a Multicloud Environment
- CGI partners with NetApp to help clients accelerate data-intensive digital transformation in the cloud
- NetApp to Participate in Upcoming Technology Conference
- NetApp reports third quarter of fiscal year 2023 results