Affinity Bancshares, Inc Announces Third Quarter 2021 Financial Results
- 89
Affinity Bancshares, Inc. (NASDAQ:“AFBI”), (the “Company”), the holding company for Affinity Bank (the “Bank”), today announced net income of $1.8 million for the three months ended September 30, 2021 as compared to $1.9 million for the corresponding prior year period. For the nine months ended September 30, 2021, the Company reported net income of $6.3 million as compared to $1.7 million for the corresponding prior year period.
This press release features multimedia. View the full release here: https://www.businesswire.com/news/home/20211027006210/en/
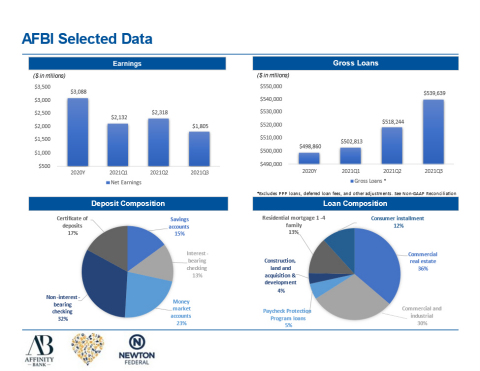
AFBI Selected Data (Graphic: Business Wire)
For the three months ended, |
For the nine months ended, |
||||||||||||||||
Performance Ratios: |
September
|
June
|
March
|
September
|
September
|
September
|
|||||||||||
Return on average assets |
0.91 |
% |
1.18 |
% |
1.11 |
% |
0.90 |
% |
1.06 |
% |
0.31 |
% |
|||||
Return on average equity |
6.00 |
% |
7.95 |
% |
8.03 |
% |
9.46 |
% |
7.29 |
% |
2.86 |
% |
|||||
Net interest margin |
3.78 |
% |
4.10 |
% |
4.65 |
% |
3.81 |
% |
4.17 |
% |
3.69 |
% |
|||||
Efficiency ratio |
65.87 |
% |
58.30 |
% |
64.96 |
% |
60.95 |
% |
63.08 |
% |
82.94 |
% |
|||||
Results of Operations
Net income was $1.8 million for the three months ended September 30, 2021, compared to $1.9 million for the three months ended September 30, 2020. We have strategically made additional hires to further enhance our business development efforts. Net income increased $4.6 million to $6.3 million for the nine months ended September 30, 2021, compared to $1.7 million for the nine months ended September 30, 2020. Our net income in 2020 was reduced as a result of merger related expenses. Merger related expenses for the nine months ended September 30, 2020, were $2.8 million.
Net Interest Income and Margin
Net interest income decreased $300,000, and was $6.9 million for the three months ended September 30, 2021, compared to $7.2 million for the three months ended September 30, 2020. Average interest-earning assets decreased by $34.5 million for the three months ended September 30, 2021. Net interest income increased $4.4 million, and was $22.6 million for the nine months ended September 30, 2021, compared to $18.2 million for the nine months ended September 30, 2020. Average interest-earning assets increased by $66.2 million for the nine months ended September 30, 2021. Net interest margin for the three months ended September 30, 2021, decreased to 3.78%, from 3.81% for the same prior year period. The net interest margin compression was primarily due to the excess balance sheet liquidity and the lower interest rate environment. Net interest margin for the nine months ended September 30, 2021, increased to 4.17% from 3.69% for the same prior year period. For the three months ended September 30, 2021, the cost of average interest-bearing liabilities decreased to 0.65% from 1.00% for the corresponding prior year period. For the nine months ended September 30, 2021, the cost of average interest-bearing liabilities decreased to 0.69% from 1.18% for the corresponding prior year period. The total cost of deposits (including non-interest-bearing deposits) was 0.60% for the three months ended September 30, 2021 compared to 1.03% for the three months ended September 30, 2020. For the nine months ended September 30, 2021, the cost of deposits was 0.66% compared to 1.21% for the nine months ended September 30, 2020. The decrease was due to decreasing deposit rates related to the decrease in market rates.
Provision for Loan Losses
For the three months ended September 30, 2021, the provision for loan loss expense was $225,000 compared to $600,000 for the three months ended September 30, 2020. We increased our provision expense in 2020 due to the uncertainty related to the pandemic. For the nine months ended September 30, 2021, the provision for loan loss expense was $975,000 compared to $1.4 million for the nine months ended September 30, 2020. As the economy began to improve in 2021, less provision expense was required. Net loan recoveries were $19,000 for the three months ended September 30, 2021, compared to $125,000 for the three months ended September 30, 2020. Net loan recoveries were $295,000 for the nine months ended September 30, 2021, compared to $177,00 for the nine months ended September 30, 2020.
Non-interest Income
For the three months ended September 30, 2021, noninterest income increased $225,000 to $771,000 compared to $546,000 for the three months ended September 30, 2020. This was a result of increases in service charges on deposits accounts, interchange income, and secondary market fee income. For the nine months ended September 30, 2021, noninterest income increased $508,000 to $2.1 million compared to $1.6 million the nine months ended September 30, 2020, due to income received from a bank-owned life insurance death benefit claim, an increase in service charges on deposits accounts, and gains on the sale of Bank owned properties.
Non-interest Expense
Operating expenses increased $275,000 to $5.0 million for the three months ended September 30, 2021, compared to $4.8 million for the three months ended September 30, 2020. We have strategically made additional hires to further enhance our business development efforts. Operating expenses decreased $817,000 to $15.6 million for the nine months ended September 30, 2021 compared to $16.4 million for the nine months ended September 30, 2020. We had an increase in salary and employee expense in 2020 due to the merger.
Income Tax Expense
We recorded income tax expense of $575,000 for each of the three months ended September 30, 2021 and 2020. We recorded income tax expense of $1.9 million for the nine months ending September 30, 2021 compared to $324,000 for the nine months ended September 30, 2020. The effective tax rate was 24.17% for the three months ended September 30, 2021 compared to 23.53% for the three months ended September 30, 2020. The effective tax rate was 23.26% for the nine months ended September 30, 2021 compared to 16.40% for the nine months ended September 30, 2020. The higher effective tax rate for the current year nine-month period was primarily due to higher net income before taxes in 2021.
Financial Condition
Total assets decreased by $60.7 million to $790.0 million at September 30, 2021, from $850.6 million at December 31, 2020. The decrease was due primarily to a decrease in cash and cash equivalents of $47.3 million due to our no longer using the Paycheck Protection Liquidity Facility (PPPLF) for funding as well as a decrease in net loans of $28.7 million. Cash and equivalents decreased $47.3 million, to $130.9 million at September 30, 2021, from $178.3 million at December 31, 2020, as the PPPLF was not used for funding at quarter end and excess cash from the stock offering was returned. Total investment securities available for sale increased by $20.0 million at September 30, 2021, as compared to December 31, 2020, as we deployed excess liquidity. Total loans decreased $27.4 million to $571.2 million at September 30, 2021 from $598.6 million at December 31, 2021, including PPP loans of $31.7 million and $101.8 million at September 30, 2021 and December 31, 2020, respectively. Deposits decreased by $24.9 million to $615.2 million at September 30, 2021 compared to $640.2 million at December 31, 2020, which reflected a decrease in certificate of deposits of $26.7 million, partly offset by an increase in non-interest-bearing deposits of $36.2 million. The loan-to-deposit ratio at September 30, 2021 was 91.6%, as compared to 92.5% at December 31, 2020. Interest-bearing checking accounts decreased $47.1 million as a result of the completion of the second step conversion. Stockholders’ equity increased to $119.7 million at September 30, 2021, as compared to $80.8 million at December 31, 2020, primarily due to the completion of our mutual-to-stock conversion and related stock offering on January 20, 2021. We sold 3,701,509 shares of common stock at $10.00 per share and raised gross proceeds of $37.1 million in the offering.
Asset Quality
The Company’s non-performing loans increased to $6.2 million at September 30, 2021, as compared to $4.9 million at December 31, 2020. The allowance for loan losses as a percentage of non-performing loans was 122.8% at September 30, 2021, as compared to 129.8% at December 31, 2020. The Company’s allowance for loan losses was 1.33% of total loans at September 30, 2021, as compared to 1.06% at December 31, 2020. The allowance as a percentage of total loans increased due to the decrease in PPP loans.
About Affinity Bancshares, Inc.
The Company is a Maryland corporation based in Covington, Georgia. The Company’s banking subsidiary, Affinity Bank, opened in 1928 and currently operates a full-service office in Atlanta, Georgia, two full-service offices in Covington, Georgia, and a loan production office serving the Alpharetta and Cumming, Georgia markets.
Average Balance Sheets
The following tables set forth average balance sheets, average annualized yields and costs, and certain other information for the periods indicated. No tax-equivalent yield adjustments have been made, as the effects would be immaterial. All average balances are monthly average balances. Non-accrual loans were included in the computation of average balances. The yields set forth below include the effect of deferred fees, discounts, and premiums that are amortized or accreted to interest income or interest expense.
|
|
For the Three Months Ended September 30, |
||||||||||||||||||
|
|
2021 |
|
2020 |
||||||||||||||||
|
|
Average
|
|
Interest |
|
Average
|
|
Average
|
|
Interest |
|
Average
|
||||||||
|
|
(Dollars in thousands) |
||||||||||||||||||
Interest-earning assets: |
|
|
|
|
|
|
|
|
|
|
|
|
||||||||
Loans excluding PPP loans |
|
$ |
520,273 |
|
|
$ |
6,470 |
|
4.97 |
% |
|
$ |
500,615 |
|
|
$ |
6,418 |
|
5.13 |
% |
PPP loans |
|
|
48,169 |
|
|
|
862 |
|
7.16 |
% |
|
|
130,352 |
|
|
|
2,108 |
|
6.47 |
% |
Securities |
|
|
40,569 |
|
|
|
216 |
|
2.13 |
% |
|
|
20,619 |
|
|
|
80 |
|
1.55 |
% |
Interest-earning deposits |
|
|
115,330 |
|
|
|
53 |
|
0.18 |
% |
|
|
107,029 |
|
|
|
36 |
|
0.13 |
% |
Other investments |
|
|
2,476 |
|
|
|
21 |
|
3.37 |
% |
|
|
2,722 |
|
|
|
29 |
|
4.26 |
% |
Total interest-earning assets |
|
|
726,817 |
|
|
|
7,622 |
|
4.19 |
% |
|
|
761,338 |
|
|
|
8,671 |
|
4.56 |
% |
Non-interest-earning assets |
|
|
64,408 |
|
|
|
|
|
|
|
67,455 |
|
|
|
|
|
||||
Total assets |
|
$ |
791,225 |
|
|
|
|
|
|
$ |
828,793 |
|
|
|
|
|
||||
|
|
|
|
|
|
|
|
|
|
|
|
|
||||||||
Interest-bearing liabilities: |
|
|
|
|
|
|
|
|
|
|
|
|
||||||||
Savings accounts |
|
$ |
93,717 |
|
|
|
100 |
|
0.43 |
% |
|
$ |
100,335 |
|
|
|
206 |
|
0.82 |
% |
Interest-bearing checking accounts |
|
|
83,519 |
|
|
|
43 |
|
0.21 |
% |
|
|
71,374 |
|
|
|
69 |
|
0.38 |
% |
Market rate checking accounts |
|
|
136,984 |
|
|
|
117 |
|
0.34 |
% |
|
|
121,118 |
|
|
|
227 |
|
0.75 |
% |
Certificates of deposit |
|
|
105,285 |
|
|
|
369 |
|
1.40 |
% |
|
|
157,911 |
|
|
|
661 |
|
1.68 |
% |
Total interest-bearing deposits |
|
|
419,505 |
|
|
|
629 |
|
0.60 |
% |
|
|
450,738 |
|
|
|
1,163 |
|
1.03 |
% |
FHLB advances |
|
|
49,039 |
|
|
|
132 |
|
1.07 |
% |
|
|
46,362 |
|
|
|
159 |
|
1.37 |
% |
PPPLF borrowings |
|
|
— |
|
|
|
— |
|
— |
|
|
|
59,118 |
|
|
|
52 |
|
0.35 |
% |
Other borrowings |
|
|
— |
|
|
|
— |
|
— |
|
|
|
10,717 |
|
|
|
46 |
|
1.72 |
% |
Total interest-bearing liabilities |
|
|
468,544 |
|
|
|
761 |
|
0.65 |
% |
|
|
566,935 |
|
|
|
1,420 |
|
1.00 |
% |
Non-interest-bearing liabilities |
|
|
203,336 |
|
|
|
|
|
|
|
183,275 |
|
|
|
|
|
||||
Total liabilities |
|
|
671,880 |
|
|
|
|
|
|
|
750,210 |
|
|
|
|
|
||||
Total stockholders' equity |
|
|
119,345 |
|
|
|
|
|
|
|
78,583 |
|
|
|
|
|
||||
Total liabilities and stockholders' equity |
|
$ |
791,225 |
|
|
|
|
|
|
$ |
828,793 |
|
|
|
|
|
||||
Net interest income |
|
|
|
$ |
6,861 |
|
|
|
|
|
$ |
7,251 |
|
|
||||||
Net interest rate spread (1) |
|
|
|
|
|
3.55 |
% |
|
|
|
|
|
3.56 |
% |
||||||
Net interest-earning assets (2) |
|
$ |
258,273 |
|
|
|
|
|
|
$ |
194,403 |
|
|
|
|
|
||||
Net interest margin (3) |
|
|
|
|
|
3.78 |
% |
|
|
|
|
|
3.81 |
% |
||||||
Average interest-earning assets to interest-bearing liabilities |
|
|
155.12 |
% |
|
|
|
|
|
|
134.29 |
% |
|
|
|
|
||||
____________________________ |
||
(1) |
Net interest rate spread represents the difference between the weighted average yield on interest-earning assets and the weighted average rate of interest-bearing liabilities. |
|
(2) |
Net interest-earning assets represent total interest-earning assets less total interest-bearing liabilities. |
|
(3) |
Net interest margin represents net interest income divided by average total interest-earning assets. |
|
|
|
For the Nine Months Ended September 30, |
||||||||||||||||||
|
|
2021 |
|
2020 |
||||||||||||||||
|
|
Average
|
|
Interest |
|
Average
|
|
Average
|
|
Interest |
|
Average
|
||||||||
|
|
(Dollars in thousands) |
||||||||||||||||||
Interest-earning assets: |
|
|
|
|
|
|
|
|
|
|
|
|
||||||||
Loans excluding PPP loans |
|
$ |
503,373 |
|
|
$ |
18,985 |
|
5.03 |
% |
|
$ |
497,271 |
|
|
$ |
19,497 |
|
5.23 |
% |
PPP loans |
|
|
92,651 |
|
|
|
5,439 |
|
7.83 |
% |
|
|
67,871 |
|
|
|
2,549 |
|
5.01 |
% |
Securities |
|
|
31,374 |
|
|
|
472 |
|
2.01 |
% |
|
|
18,871 |
|
|
|
304 |
|
2.15 |
% |
Interest-earning deposits |
|
|
92,880 |
|
|
|
134 |
|
0.19 |
% |
|
|
69,617 |
|
|
|
185 |
|
0.35 |
% |
Federal Home Loan Bank of Atlanta stock |
|
|
2,273 |
|
|
|
57 |
|
3.32 |
% |
|
|
2,692 |
|
|
|
88 |
|
4.36 |
% |
Total interest-earning assets |
|
|
722,551 |
|
|
|
25,087 |
|
4.63 |
% |
|
|
656,322 |
|
|
|
22,623 |
|
4.60 |
% |
Non-interest-earning assets |
|
|
63,028 |
|
|
|
|
|
|
|
60,721 |
|
|
|
|
|
||||
Total assets |
|
$ |
785,579 |
|
|
|
|
|
|
$ |
717,043 |
|
|
|
|
|
||||
|
|
|
|
|
|
|
|
|
|
|
|
|
||||||||
Interest-bearing liabilities: |
|
|
|
|
|
|
|
|
|
|
|
|
||||||||
Savings accounts |
|
$ |
93,823 |
|
|
|
310 |
|
0.44 |
% |
|
$ |
85,261 |
|
|
|
725 |
|
1.13 |
% |
Interest-bearing checking accounts |
|
|
88,154 |
|
|
|
138 |
|
0.21 |
% |
|
|
65,285 |
|
|
|
214 |
|
0.44 |
% |
Market rate checking accounts |
|
|
130,933 |
|
|
|
378 |
|
0.39 |
% |
|
|
108,383 |
|
|
|
794 |
|
0.98 |
% |
Certificates of deposit |
|
|
114,623 |
|
|
|
1,284 |
|
1.49 |
% |
|
|
159,240 |
|
|
|
2,056 |
|
1.72 |
% |
Total interest-bearing deposits |
|
|
427,533 |
|
|
|
2,110 |
|
0.66 |
% |
|
|
418,169 |
|
|
|
3,790 |
|
1.21 |
% |
FHLB advances |
|
|
41,471 |
|
|
|
350 |
|
1.13 |
% |
|
|
49,770 |
|
|
|
531 |
|
1.42 |
% |
PPPLF borrowings |
|
|
1,368 |
|
|
|
4 |
|
0.35 |
% |
|
|
24,255 |
|
|
|
63 |
|
0.35 |
% |
Other borrowings |
|
|
559 |
|
|
|
11 |
|
2.58 |
% |
|
|
8,054 |
|
|
|
55 |
|
0.92 |
% |
Total interest-bearing liabilities |
|
|
470,931 |
|
|
|
2,475 |
|
0.69 |
% |
|
|
500,248 |
|
|
|
4,439 |
|
1.18 |
% |
Non-interest-bearing liabilities |
|
|
199,971 |
|
|
|
|
|
|
|
139,728 |
|
|
|
|
|
||||
Total liabilities |
|
|
670,902 |
|
|
|
|
|
|
|
639,976 |
|
|
|
|
|
||||
Total stockholders' equity |
|
|
114,677 |
|
|
|
|
|
|
|
77,066 |
|
|
|
|
|
||||
Total liabilities and stockholders' equity |
|
$ |
785,579 |
|
|
|
|
|
|
$ |
717,042 |
|
|
|
|
|
||||
Net interest income |
|
|
|
$ |
22,612 |
|
|
|
|
|
$ |
18,184 |
|
|
||||||
Net interest rate spread (1) |
|
|
|
|
|
3.94 |
% |
|
|
|
|
|
3.42 |
% |
||||||
Net interest-earning assets (2) |
|
$ |
251,620 |
|
|
|
|
|
|
$ |
156,074 |
|
|
|
|
|
||||
Net interest margin (3) |
|
|
|
|
|
4.17 |
% |
|
|
|
|
|
3.69 |
% |
||||||
Average interest-earning assets to interest-bearing liabilities |
|
|
153.43 |
% |
|
|
|
|
|
|
131.20 |
% |
|
|
|
|
||||
____________________________ |
||
(1) |
Net interest rate spread represents the difference between the weighted average yield on interest-earning assets and the weighted average rate of interest-bearing liabilities. |
|
(2) |
Net interest-earning assets represent total interest-earning assets less total interest-bearing liabilities. |
|
(3) |
Net interest margin represents net interest income divided by average total interest-earning assets. |
|
AFFINITY BANCSHARES, INC.
|
||||||||
|
|
September 30, 2021 |
|
December 31, 2020 |
||||
|
|
(unaudited) |
|
|
||||
|
|
(In thousands) |
||||||
Assets |
||||||||
|
|
|
|
|
||||
Cash and due from banks, including reserve requirement of $0 at September 30, 2021
|
|
$ |
17,321 |
|
|
$ |
5,552 |
|
Interest-earning deposits in other depository institutions |
|
|
113,589 |
|
|
|
172,701 |
|
Cash and cash equivalents |
|
|
130,910 |
|
|
|
178,253 |
|
Investment securities available-for-sale |
|
|
44,071 |
|
|
|
24,005 |
|
Other investments |
|
|
2,476 |
|
|
|
1,596 |
|
Loans, net |
|
|
563,539 |
|
|
|
592,254 |
|
Other real estate owned |
|
|
— |
|
|
|
1,292 |
|
Premises and equipment, net |
|
|
7,425 |
|
|
|
8,617 |
|
Bank owned life insurance |
|
|
15,285 |
|
|
|
15,311 |
|
Intangible assets |
|
|
18,797 |
|
|
|
18,940 |
|
Accrued interest receivable and other assets |
|
|
7,462 |
|
|
|
10,360 |
|
Total assets |
|
$ |
789,965 |
|
|
$ |
850,628 |
|
|
|
|
|
|
||||
Liabilities and Stockholders' Equity |
||||||||
|
|
|
|
|
||||
Liabilities: |
|
|
|
|
||||
Savings accounts |
|
$ |
92,003 |
|
|
$ |
96,591 |
|
Interest-bearing checking |
|
|
82,750 |
|
|
|
129,813 |
|
Market rate checking |
|
|
138,592 |
|
|
|
121,317 |
|
Non-interest-bearing checking |
|
|
196,990 |
|
|
|
160,819 |
|
Certificate of deposits |
|
|
104,896 |
|
|
|
131,625 |
|
Total deposits |
|
|
615,231 |
|
|
|
640,165 |
|
Federal Home Loan Bank advances |
|
|
49,020 |
|
|
|
19,117 |
|
Paycheck Protection Program Liquidity Facility (PPPLF) borrowings |
|
|
— |
|
|
|
100,813 |
|
Other borrowings |
|
|
— |
|
|
|
5,000 |
|
Accrued interest payable and other liabilities |
|
|
6,011 |
|
|
|
4,748 |
|
Total liabilities |
|
|
670,262 |
|
|
|
769,843 |
|
|
|
|
|
|
||||
Stockholders' equity: |
|
|
|
|
||||
Common stock (par value $0.01 per share, 40,000,000 shares authorized,
|
|
|
69 |
|
|
|
77 |
|
Preferred stock (10,000,000 shares authorized, no shares outstanding at September 30,
|
|
|
— |
|
|
|
— |
|
Additional paid in capital |
|
|
67,899 |
|
|
|
33,620 |
|
Treasury stock, 102,816 shares at December 31, 2020, at cost (1) |
|
|
— |
|
|
|
(1,268 |
) |
Unearned ESOP shares |
|
|
(5,056 |
) |
|
|
(2,453 |
) |
Retained earnings |
|
|
56,905 |
|
|
|
50,650 |
|
Accumulated other comprehensive (loss) income |
|
|
(114 |
) |
|
|
159 |
|
Total stockholders' equity |
|
|
119,703 |
|
|
|
80,785 |
|
Total liabilities and stockholders' equity |
|
$ |
789,965 |
|
|
$ |
850,628 |
|
(1) |
Amounts related to periods prior to the date of Conversion (January 20, 2021) have been restated to give the retroactive recognition to the exchange ratio applied in the Conversion (0.90686) (see Note 1).
|
AFFINITY BANCSHARES, INC.
|
|||||||||||||
|
|
Three Months Ended
|
|
Nine Months Ended
|
|||||||||
|
|
2021 |
|
2020 |
|
2021 |
|
|
2020 |
||||
|
|
|
|
(In thousands) |
|
|
|||||||
Interest income: |
|
|
|
|
|
|
|
|
|||||
Loans, including fees |
|
$ |
7,332 |
|
$ |
8,526 |
|
$ |
24,424 |
|
|
$ |
22,046 |
Investment securities, including dividends |
|
|
237 |
|
|
109 |
|
|
529 |
|
|
|
392 |
Interest-earning deposits |
|
|
53 |
|
|
36 |
|
|
134 |
|
|
|
185 |
Total interest income |
|
|
7,622 |
|
|
8,671 |
|
|
25,087 |
|
|
|
22,623 |
Interest expense: |
|
|
|
|
|
|
|
|
|||||
Deposits |
|
|
629 |
|
|
1,163 |
|
|
2,110 |
|
|
|
3,789 |
Borrowings |
|
|
132 |
|
|
257 |
|
|
365 |
|
|
|
649 |
Total interest expense |
|
|
761 |
|
|
1,420 |
|
|
2,475 |
|
|
|
4,438 |
Net interest income before provision for loan losses |
|
|
6,861 |
|
|
7,251 |
|
|
22,612 |
|
|
|
18,185 |
Provision for loan losses |
|
|
225 |
|
|
600 |
|
|
975 |
|
|
|
1,400 |
Net interest income after provision for loan losses |
|
|
6,636 |
|
|
6,651 |
|
|
21,637 |
|
|
|
16,785 |
Noninterest income: |
|
|
|
|
|
|
|
|
|||||
Service charges on deposit accounts |
|
|
416 |
|
|
351 |
|
|
1,126 |
|
|
|
1,009 |
Gain on sales of investment securities available-for-sale |
|
|
— |
|
|
— |
|
|
— |
|
|
|
20 |
Other |
|
|
355 |
|
|
195 |
|
|
980 |
|
|
|
569 |
Total noninterest income |
|
|
771 |
|
|
546 |
|
|
2,106 |
|
|
|
1,598 |
Noninterest expenses: |
|
|
|
|
|
|
|
|
|||||
Salaries and employee benefits |
|
|
2,715 |
|
|
2,415 |
|
|
7,609 |
|
|
|
8,767 |
Deferred compensation |
|
|
62 |
|
|
70 |
|
|
188 |
|
|
|
211 |
Occupancy |
|
|
633 |
|
|
734 |
|
|
2,329 |
|
|
|
2,071 |
Advertising |
|
|
116 |
|
|
40 |
|
|
296 |
|
|
|
173 |
Data processing |
|
|
520 |
|
|
523 |
|
|
1,518 |
|
|
|
1,773 |
Other real estate owned |
|
|
— |
|
|
9 |
|
|
19 |
|
|
|
11 |
Net (gain) loss on sale of other real estate owned |
|
|
— |
|
|
159 |
|
|
(127 |
) |
|
|
188 |
Legal and accounting |
|
|
153 |
|
|
230 |
|
|
555 |
|
|
|
1,196 |
Organizational dues and subscriptions |
|
|
105 |
|
|
70 |
|
|
266 |
|
|
|
238 |
Director compensation |
|
|
50 |
|
|
51 |
|
|
150 |
|
|
|
153 |
Federal deposit insurance premiums |
|
|
61 |
|
|
51 |
|
|
201 |
|
|
|
304 |
Writedown of premises and equipment |
|
|
14 |
|
|
— |
|
|
888 |
|
|
|
— |
Other |
|
|
598 |
|
|
400 |
|
|
1,700 |
|
|
|
1,324 |
Total noninterest expenses |
|
|
5,027 |
|
|
4,752 |
|
|
15,592 |
|
|
|
16,409 |
Income before income taxes |
|
|
2,380 |
|
|
2,445 |
|
|
8,151 |
|
|
|
1,974 |
Income tax expense |
|
|
575 |
|
|
575 |
|
|
1,896 |
|
|
|
324 |
Net income (loss) |
|
$ |
1,805 |
|
$ |
1,870 |
|
$ |
6,255 |
|
|
$ |
1,650 |
Basic earnings per share (1) |
|
$ |
0.26 |
|
$ |
0.25 |
|
$ |
0.90 |
|
|
$ |
0.22 |
Diluted earnings per share (1) |
|
$ |
0.26 |
|
$ |
0.25 |
|
$ |
0.89 |
|
|
$ |
0.22 |
(1) |
Amounts related to periods prior to the date of the Conversion (January 20, 2021) have been restated to give the retroactive recognition to the exchange ratio applied in the Conversion (0.90686-to-one) (see Note 1). |
Non-GAAP Reconciliation
Reported amounts for total loans are presented in accordance with GAAP. The Company’s management believes that the following supplemental non-GAAP information, which consists of total loans excluding PPP loans, deferred loan fees and other loan adjustments (consisting of loans in process), provides a better comparison of the amount of the Company’s loan portfolio. Additionally, the Company believes this information is utilized by market analysts to evaluate a company’s financial condition and, therefore, such information is useful to investors. These disclosures should not be viewed as a substitute for financial results in accordance with GAAP, nor are they necessarily comparable to non-GAAP performance measures which may be presented by other companies.
|
September 30,
|
June 30,
|
March 31,
|
December 31,
|
|||||||
|
(In thousands) |
||||||||||
Non-GAAP Reconciliation |
|
|
|
|
|
|
|
||||
Total Loans |
$ |
571,170 |
$ |
590,011 |
$ |
626,096 |
$ |
598,615 |
|||
Plus: |
|||||||||||
Fair Value Marks |
|
1,423 |
|
1,497 |
|
1,607 |
|
1,773 |
|||
Less: |
|||||||||||
Payroll Protection Program loans |
|
31,715 |
|
71,862 |
|
123,996 |
|
100,142 |
|||
Deferred loan fees |
|
1,136 |
|
987 |
|
878 |
|
795 |
|||
Other Loan Adjustments |
|
103 |
|
415 |
|
16 |
|
591 |
|||
Gross Loans |
$ |
539,639 |
$ |
18,244 |
$ |
502,813 |
$ |
498,860 |
|||
View source version on businesswire.com: https://www.businesswire.com/news/home/20211027006210/en/

- Vaxxinity Issues Shareholder Letter
- ContextLogic Completes Sale of Substantially All Operating Assets and Liabilities Associated with Wish to Qoo10
- Portland General Electric declares dividend
- Voxtur Engages ICP Securities Inc. for Automated Market Making Services
- 76 partners are ready to collaborate through the First Wonderful Indonesia Co-Branding Forum (WICF) in 2024.
- TCTM Filed 2023 Annual Report on Form 20-F