Technical analyses - Indices - English - without AI analysis - Page 2
You are currently viewing all technical analyses in Indices market in English without AI analysis regarding all markets, sorted by Latest posted.
Sort : Latest comments | Latest posted
S&P500 INDEX
> Analyses
Thank you
Reply
Chart
ODK has published a new analysis.
- 34
- 214
- 231
- 1
Timeframe : Daily - Simple chart
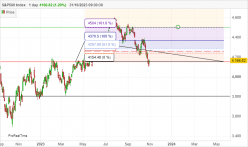
S&P 500 tem um Pivot em 4157
Inclusive Nasdaq também em cima da linha
O que está sendo respeitado
Caso perca vamos a 3808
Os números de hoje batem com gráfico feito messes atrás
Ou seja…
HANG SENG > Analyses

 Thank you
Reply

Exness has published a new analysis.
- 16
- 343
- 52
- 0

Timeframe : Daily - Simple chart
The Hang Seng index has been under pressure recently amid a plummeting Nasdaq and the continuation of escalation in the global bond markets. The level of market fear increases, as VIX crosses 20,…
NASDAQ COMPOSITE INDEX
> Analyses
Thank you
Reply
Chart
ODK has published a new analysis.
- 34
- 214
- 231
- 1
Timeframe : Daily - Simple chart
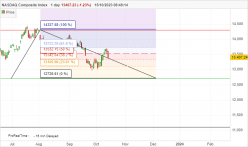
Pivot em 12718
Lateral respeitando fibo
Bastante desanimador
Vamos ver se proeta para os 100% em 14337
Boa sorte !!!!!!
NASDAQ US 500 LARGE CAP GROWTH INDEX
> Analyses

 Thank you
Reply
Chart

Exness has published a new analysis.
- 16
- 343
- 52
- 0

Timeframe : Daily - Simple chart
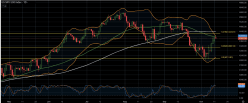
US stock futures initially rose but then pared gains after the CPI report showed slightly higher than expected inflation. The CPI increased by 0.4% last month, lower than August but more than market…
S&P500 INDEX
> Analyses
Thank you
Reply
Chart
S P/ ASX 200 INDEX
> Analyses

 Thank you
Reply
Chart

Exness has published a new analysis.
- 16
- 343
- 52
- 0

Timeframe : Daily - Simple chart
Australia's leading stock market index, the S&P/ASX 200, has been on a downward trend for the past three weeks. From a technical perspective, the price still remains in a consolidation, but the…
S&P500 INDEX
> Analyses

 Thank you
Reply
Chart

Exness has published a new analysis.
- 16
- 343
- 52
- 0

Timeframe : Daily - Simple chart
The S&P 500 as well as Nasdaq 100 closed with modest gains in yesterday's session after the publication of the inflation data from the US. The US consumer price report showed an increase in…
FTSE 100 > Analyses
Thank you
Reply
DAX40 PERF INDEX
> Analyses
 Thank you
Reply
Chart

Vincent Launay EN has published a new analysis.
- 20
- 42
- 60
- 6
Timeframe : Daily - Chart + One way trading
S&P500 INDEX
> Analyses

 Thank you
Reply
Chart

Exness has published a new analysis.
- 16
- 343
- 52
- 0

Timeframe : Daily - Simple chart
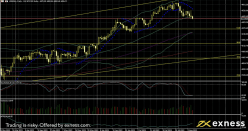
The S&P 500 didn’t react strongly to the release of numbers on inflation, but on Friday 11 August sentiment was somewhat dented by higher producer prices in the USA. These might suggest that the…
NASDAQ100 INDEX
> Analyses

 Thank you
Reply
Chart

Exness has published a new analysis.
- 16
- 343
- 52
- 0

Timeframe : Daily - Simple chart
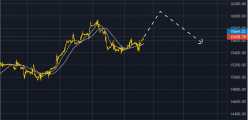
This week, FED raised the interest rate for one step, as expected. The federal reserve had changed its economic outlook from “modest” to “moderate”. The interest rate remains to stay…
NASDAQ COMPOSITE INDEX
> Analyses
Thank you
Reply
Chart
ODK has published a new analysis.
- 34
- 214
- 231
- 1
Timeframe : Daily - Simple chart
.....para todos os outros Amercianos eu considero
Testou 261.8% do Fibo
Volta a subir rumo a 423.6%
Movimento é altista
Observe DJI, não tem aqui
E veja S&P 500
Coincidencia?
Boa sorte…
S&P500 INDEX
> Analyses
Thank you
Reply
Chart
ODK has published a new analysis.
- 34
- 214
- 231
- 1
Timeframe : Daily - Simple chart
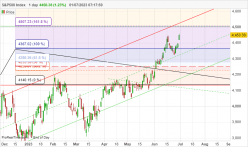
Testou suporte em 100% (4367)
Voltou a subir
Pode bater 4507 em 161.8% do fibo
Movimento altista
Boa Sorte !!!!!
SMI20 INDEX
> Analyses
Thank you
Reply
Chart
NASDAQ100 INDEX
> Analyses

 Thank you
Reply
Chart

Exness has published a new analysis.
- 16
- 343
- 52
- 0

Timeframe : Daily - Simple chart
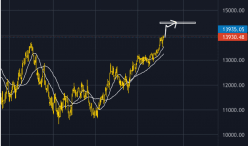
Nasdaq is showing relative strength after a spectacular growth of NVDA and the overall strength of big tech stocks, which account for around 40% of the total holdings on Nasdaq. As the momentum is…
IBEX35 INDEX
> Analyses
Thank you
Reply
Chart
NIKKEI 225
> Analyses

 Thank you
Reply
Chart

Exness has published a new analysis.
- 16
- 343
- 52
- 0

Timeframe : Daily - Simple chart
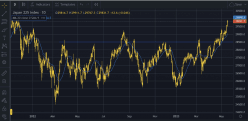
JP225 has been trending up since the third week of March. Economic news from both the US and Japan are the contributing factors to the bullish trend. In the short term, a breach of 30,000 seems…

