Technical analyses - Indices - English - without AI analysis - Page 3
You are currently viewing all technical analyses in Indices market in English without AI analysis regarding all markets, sorted by Latest comments.
Sort : Latest comments | Latest posted
IBEX35 INDEX
> Analyses
Thank you
Reply
Chart
NIKKEI 225
> Analyses

 Thank you
Reply
Chart

Exness has published a new analysis.
- 16
- 343
- 52
- 0

Timeframe : Daily - Simple chart
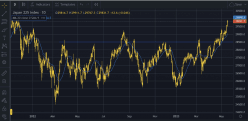
JP225 has been trending up since the third week of March. Economic news from both the US and Japan are the contributing factors to the bullish trend. In the short term, a breach of 30,000 seems…
NASDAQ COMPOSITE INDEX
> Analyses
Thank you
Reply
Chart
CRUDE OIL VIX > Analyses

 Thank you
Reply

Exness has published a new analysis.
- 16
- 343
- 52
- 0

Timeframe : Daily - Simple chart
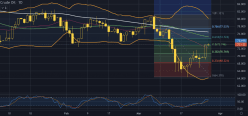
Crude oil prices are currently in a phase of strong bullish momentum build up after a strong move on Monday mostly due to some exports from Iraq's Kurdistan region being on halt. Prices were boosted…
CNX NIFTY INDEX > Analyses
Thank you
Reply
NASDAQ100 INDEX
> Analyses

 Thank you
Reply
Chart

Exness has published a new analysis.
- 16
- 343
- 52
- 0

Timeframe : Daily - Simple chart
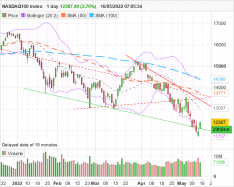
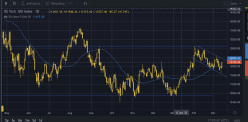
The Nasdaq Index seems relatively unhampered by the sluggish news coming from the banking sector. Also, yearly CPI data came as expected, and core CPI rose by 0.5% above January. The index has stood…
NASDAQ COMPOSITE INDEX
> Analyses
Thank you
Reply
Chart
ODK has published a new analysis.
- 34
- 214
- 231
- 1
Timeframe : Daily - Simple chart
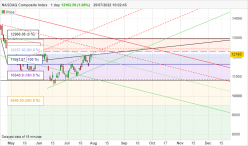
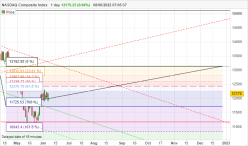
Continua vendido
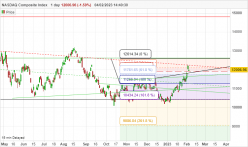
Abaixo do pivot, mas reage bem, um momento altista.
Pivot em 12639.
Ultrapassando vamos a 14823.
Chega de baixa, rs.
Estudo é de longo prazo.
Se perder os 100% em 11266,…
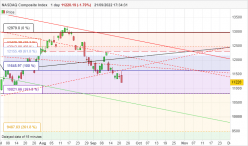
NASDAQ COMPOSITE INDEX
> Analyses
Thank you
Reply
Chart
ODK has published a new analysis.
- 34
- 214
- 231
- 1
Timeframe : Daily - Simple chart
Já Nasdaq deixa duvidas
Bateu no Pivot, está vendido, voltou, mas veja que quando chegou em 61,8%
Virou pra cima novamente
Portanto temos
Pivot em 11.498
161,8% em 12.681
Se for baixa…
S&P500 INDEX
> Analyses
Thank you
Reply
Chart
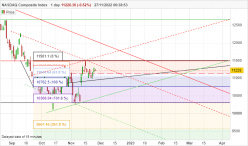
NASDAQ COMPOSITE INDEX
> Analyses
Thank you
Reply
Chart
ODK has published a new analysis.
- 34
- 214
- 231
- 1
Timeframe : Daily - Simple chart
Opa! Opa!
Atingiu o pivot, se sustentar, resistência vira suporte, portanto entra no comprado, ai é só alegria, kkkkkk
S&P 500 também foi.
Abaixo os parametros do estudo anterior, são…
NASDAQ COMPOSITE INDEX
> Analyses
Thank you
Reply
Chart
ODK has published a new analysis.
- 34
- 214
- 231
- 1
Timeframe : Daily - Simple chart
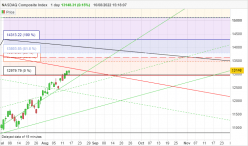
Temos pivot em 12980, portanto abaixo, está vendido.
Assim como o S&P, está subindo e vencendo as resistências.
Em 10831 é 161.8%, não acredito que volte lá.
Um corredor de alta lento…
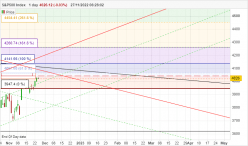
S&P500 INDEX
> Analyses
Thank you
Reply
Chart
ODK has published a new analysis.
- 34
- 214
- 231
- 1
Timeframe : Daily - Simple chart
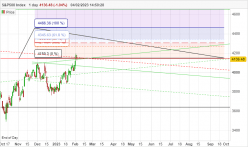
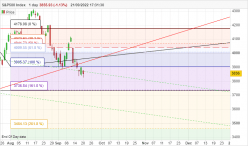
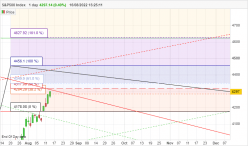
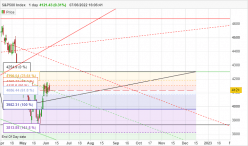
Temos um PIVOT em (4255), se está abaixo continua vendido, mas,
repare que ele já bateu em 1618%, que é justamente o suporte em (3870).
Agora está lutando na frequencia de 61,8% 50% e…
NASDAQ100 INDEX
> Analyses
Thank you
Reply
Chart

