Technical analyses - WALMART INC. - English

You are currently viewing all technical analyses of the financial instrument WALMART INC. regarding all markets in English regarding all markets, sorted by Latest comments.


WALMART INC. > Analyses
Exness
Exness has published a new analysis.
  • 16
  • 343
  • 52
  • 0
WALMART INC. - Daily

Timeframe : Daily - Simple chart

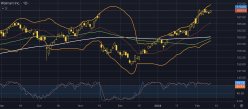
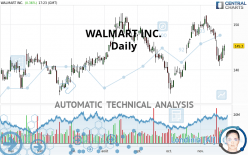
Shares of Walmart Inc. (symbol ‘WMT’) managed to remain positive and rose by around 1% for the quarter. The company’s earnings report for the fiscal quarter ending January 2024 is expected to be…
Chart
WALMART INC. > Analyses
Londinia
Londinia AI has published a new analysis for hsokkar.
  • 0
  • 71980
  • 15096
  • 0
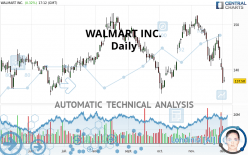
WALMART INC. - Daily

Timeframe : Daily - Simple chart
Status : LEVEL MAINTAINED

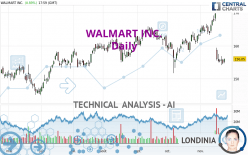
All elements being clearly bearish, it would be possible for traders to trade only short positions (for sale) on WALMART INC. as long as the price remains well below 161.25 USD. The sellers' bearish…
Chart
WALMART INC. > Analyses
Exness
Exness has published a new analysis.
  • 16
  • 343
  • 52
  • 0
WALMART INC. - Daily

Timeframe : Daily - Simple chart

Chart
WALMART INC. > Analyses
Exness
Exness has published a new analysis.
  • 16
  • 343
  • 52
  • 0
WALMART INC. - Daily

Timeframe : Daily - Simple chart

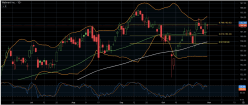
Shares of Walmart Inc. (symbol ‘WMT’) managed to remain positive and actually rose by around 2% for the quarter. The company’s earnings report for the fiscal quarter ending October 2023 is…
Chart
WALMART INC. > Analyses
elliottwaveforecast has published a new analysis.
  • 9
  • 464
  • 301
  • 0
WALMART INC. - Daily
Chart
WALMART INC. > Analyses
Exness
Exness has published a new analysis.
  • 16
  • 343
  • 52
  • 0
WALMART INC. - Daily

Timeframe : Daily - Simple chart

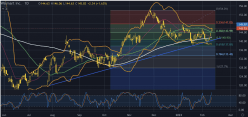
Shares in Walmart, Inc. (symbol ‘WMT’) managed to recover from the losses incurred in the first quarter of the year and is currently in profit area testing the latest high of November 2022. The…
Chart
WALMART INC. > Analyses
Exness
Exness has published a new analysis.
  • 16
  • 343
  • 52
  • 0
WALMART INC. - Monthly

Timeframe : Monthly - Simple chart

Shares in Walmart Inc (symbol ‘WMT’) made a relatively aggressive rally in October and November only to lose some of these gains in December until early February. Currently the price seems to be…
Chart
WALMART INC. > Analyses
Londinia
Londinia AI has published a new analysis for AMIKOTUN.
  • 0
  • 71980
  • 15096
  • 0
WALMART INC. - Daily

Timeframe : Daily - Simple chart
Status : LEVEL MAINTAINED
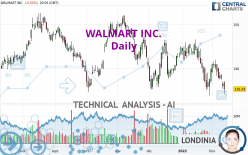
WALMART INC. is part of a very strong bearish trend. Traders may consider trading only short positions (for sale) as long as the price remains well below 140.06 USD. The next support located at 100.89…
Chart
WALMART INC. > Analyses
Londinia
Londinia AI has published a new analysis for Vincent Launay.
  • 0
  • 71980
  • 15096
  • 0
WALMART INC. - 1H

Timeframe : 1H - Simple chart
Status : LEVEL MAINTAINED

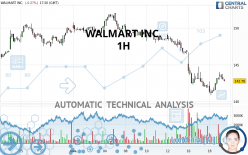
The current short-term bearish acceleration registered on WALMART INC. should quickly allow the basic trend to return to a bearish trend. To avoid contradicting the short term, traders could favour…
Chart
WALMART INC. > Analyses
Londinia
Londinia AI has published a new analysis for DipFarda.
  • 0
  • 71980
  • 15096
  • 0
WALMART INC. - Daily

Timeframe : Daily - Simple chart
Status : INVALID
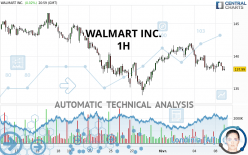
All elements being clearly bearish, it would be possible for traders to trade only short positions (for sale) on WALMART INC. as long as the price remains well below 139.62 USD. The sellers' bearish…
Chart
WALMART INC. > Analyses
Londinia
Londinia AI has published a new analysis for Rom_bitc.
  • 0
  • 71980
  • 15096
  • 0
WALMART INC. - 1H

Timeframe : 1H - Simple chart
Status : TARGET REACHED
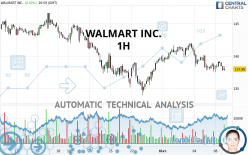
The bearish trend is currently very strong for WALMART INC.. As long as the price remains below the resistance at 139.62 USD, you could try to take advantage of the bearish rally. The first bearish…
Chart
WALMART INC. > Analyses
Londinia
Londinia AI has published a new analysis for Rom_bitc.
  • 0
  • 71980
  • 15096
  • 0
WALMART INC. - 1H

Timeframe : 1H - Simple chart
Status : TARGET REACHED

WALMART INC. is part of a very strong bearish trend. Traders may consider trading only short positions (for sale) as long as the price remains well below 139.62 USD. The next support located at 135.42…
Chart
WALMART INC. > Analyses
Londinia
Londinia AI has published a new analysis for Vincent Launay.
  • 0
  • 71980
  • 15096
  • 0
WALMART INC. - Daily

Timeframe : Daily - Simple chart
Status : TARGET REACHED
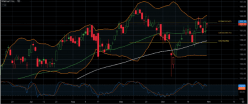
WALMART INC. is part of a very strong bearish trend. Traders may consider trading only short positions (for sale) as long as the price remains well below 142.69 USD. The next support located at 135.42…
Chart
WALMART INC. > Analyses
Londinia
Londinia AI has published a new analysis for Vincent Launay.
  • 0
  • 71980
  • 15096
  • 0
WALMART INC. - Daily

Timeframe : Daily - Simple chart
Status : INVALID

The bearish trend is currently very strong for WALMART INC.. As long as the price remains below the resistance at 142.32 USD, you could try to take advantage of the bearish rally. The first bearish…
Chart
WALMART INC. > Analyses
Londinia
Londinia AI has published a new analysis for Vincent Launay.
  • 0
  • 71980
  • 15096
  • 0
WALMART INC. - Daily

Timeframe : Daily - Simple chart
Status : INVALID

Has the basic bullish trend slowed or is it lacking in power? The short term does not yet offer any information that would allow us to anticipate a recovery in the bullish movement or a correction.…
Chart
WALMART INC. > Analyses
Londinia
Londinia AI has published a new analysis for Vincent Launay.
  • 0
  • 71980
  • 15096
  • 0
WALMART INC. - 1H

Timeframe : 1H - Simple chart
Status : INVALID

The bearish basic trend is very strong on WALMART INC. but the short term shows some signs of running out of steam. However, a sale could be considered as long as the price remains below 144.30 USD.…
Chart
WALMART INC. > Analyses
Londinia
Londinia AI has published a new analysis for Vincent Launay.
  • 0
  • 71980
  • 15096
  • 0
WALMART INC. - 1H

Timeframe : 1H - Simple chart
Status : LEVEL MAINTAINED

The strong short-term increase of WALMART INC. should quickly allow the basic trend to become bullish. As long as the price remains above the support located at 137.67 USD, a purchase could be…
Chart
WALMART INC. > Analyses
Londinia
Londinia AI has published a new analysis for Vincent Launay.
  • 0
  • 71980
  • 15096
  • 0
WALMART INC. - 1H

Timeframe : 1H - Simple chart
Status : INVALID

WALMART INC. is part of a very strong bearish trend. Traders may consider trading only short positions (for sale) as long as the price remains well below 145.42 USD. The next support located at 142.30…
Chart
WALMART INC. > Analyses
Londinia
Londinia AI has published a new analysis for Vincent Launay.
  • 0
  • 71980
  • 15096
  • 0
WALMART INC. - 1H

Timeframe : 1H - Simple chart
Status : TARGET REACHED
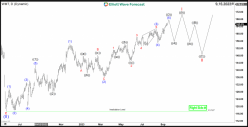
The strong short-term increase of WALMART INC. should quickly allow the basic trend to become bullish. As long as the price remains above the support located at 135.94 USD, a purchase could be…
Chart
WALMART INC. > Analyses
Londinia
Londinia AI has published a new analysis for Vincent Launay.
  • 0
  • 71980
  • 15096
  • 0
WALMART INC. - 1H

Timeframe : 1H - Simple chart
Status : TARGET REACHED

All elements being clearly bearish, it would be possible for traders to trade only short positions (for sale) on WALMART INC. as long as the price remains well below 141.24 USD. The sellers' bearish…
Chart