Technical analyses - FTSE 100 - English
You are currently viewing all technical analyses of the financial instrument FTSE 100 regarding all markets in English regarding all markets, sorted by Latest posted.
Sort : Latest comments | Latest posted
FTSE 100 > Analyses
Thank you
Reply
FTSE 100 > Analyses

 Thank you
Reply

Melina Deltas has published a new analysis.
- 90
- 836
- 1878
- 0

Timeframe : 4H - Simple chart
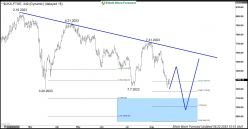
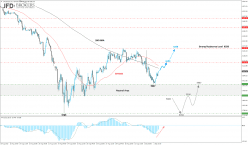
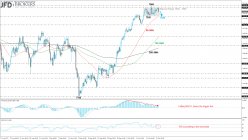
The FTSE 100 index is developing in a trading range over the last six days with low at 7520 support level and high at 7555 resistance barrier. The U.K. index currently is plunging and is approaching…
FTSE 100 > Analyses

 Thank you
Reply

Barbara Nicodemou has published a new analysis.
- 24
- 127
- 302
- 4

Timeframe : Daily - Simple chart
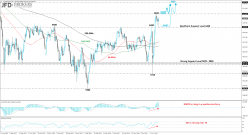
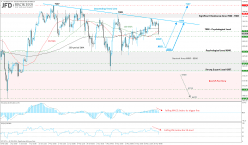
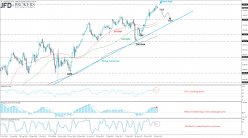
The FTSE 100 index had an aggressive bullish run since the previous month as it added more than 4.5% at its value. The price printed a fresh all-time high during previous week’s session at 7599.50…
FTSE 100 > Analyses

 Thank you
Reply

Melina Deltas has published a new analysis.
- 90
- 836
- 1878
- 0

Timeframe : Daily - Simple chart
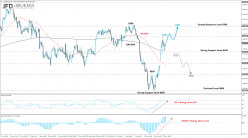
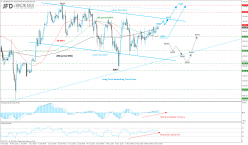
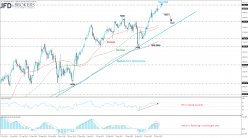
The FTSE 100 index had an aggressive bullish run over the previous month as it added more than 4% at its value. The price printed a fresh all-time high during yesterday’s session at 7586.75 while…
FTSE 100 > Analyses

 Thank you
Reply

Melina Deltas has published a new analysis.
- 90
- 836
- 1878
- 0

Timeframe : Daily - Simple chart
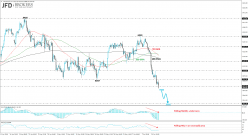
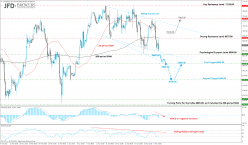
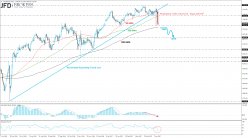
After the announcement of U.K. Prime Minister yesterday, the stock U.K. index FTSE 100 had a sharp sell-off which is still in progress. It penetrated the ascending trend line to the downside which was…
FTSE 100 > Analyses

 Thank you
Reply

Melina Deltas has published a new analysis.
- 90
- 836
- 1878
- 0

Timeframe : Daily - Simple chart
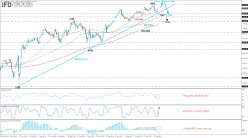
After hitting a new all-time high at 7445 on March 16th, the FTSE 100 index has weakened in the previous week and met the ascending trend line at 7260 which stands over the last nine months. However,…
FTSE 100 > Analyses

 Thank you
Reply

Melina Deltas has published a new analysis.
- 90
- 836
- 1878
- 0

Timeframe : Daily - Simple chart
The pressure in the FTSE100 that was holding over the previous periods seems came to an end as the price had a rebound on the 50-daily SMA during the week before. Since February 1st, the index climbed…
FTSE 100 > Analyses

 Thank you
Reply

Barbara Nicodemou has published a new analysis.
- 24
- 127
- 302
- 4

Timeframe : Daily - Simple chart
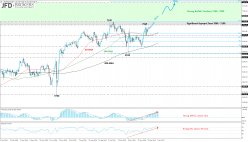
On the other hand, the FTSE100 is experiencing the longest run in almost 20-years, printing the eighth consecutive day of records high. The index surpassed above the strong resistance level at 7130,…
FTSE 100 > Analyses

 Thank you
Reply

Barbara Nicodemou has published a new analysis.
- 24
- 127
- 302
- 4

Timeframe : Daily - Simple chart
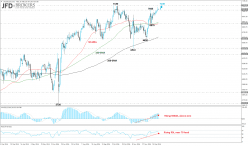
The FTSE100 index edged sharply higher over this month, adding 5% gains in December following the strong support that found on the 100-weekly SMA which overlaps with the 6510 barrier. The price…
FTSE 100 > Analyses

 Thank you
Reply

Melina Deltas has published a new analysis.
- 90
- 836
- 1878
- 0

Timeframe : 4H - Simple chart
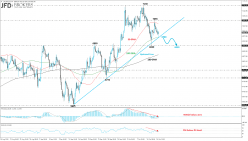
The FTSE 100 index surged more than 11% since June and is recording the fifth green monthly candle in a row. The index is developing above the ascending trend line in the short-term timeframe which is…
FTSE 100 > Analyses

 Thank you
Reply

Melina Deltas has published a new analysis.
- 90
- 836
- 1878
- 0

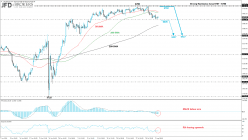
Timeframe : 4H - Simple chart
The FTSE100 index has been gradually moving higher the last two months and reached the one-year high at 6767 following a strong rally after the rebound on 5728 support barrier. During this week the…
FTSE 100 > Analyses
Thank you
Reply
FTSE 100 > Analyses
Thank you
Reply
FTSE 100 > Analyses
Thank you
Reply
FTSE 100 > Analyses
Thank you
Reply
FTSE 100 > Analyses
Thank you
Reply
FTSE 100 > Analyses
Thank you
Reply
FTSE 100 > Analyses
Thank you
Reply
FTSE 100 > Analyses

 Thank you
Reply

TC Trader has published a new analysis.
- 75
- 597
- 54
- 3

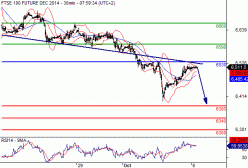
Timeframe : 30 min. - Chart + Price target(s)
Our preference: Short positions below 6530 with targets @ 6380 & 6340 in extension.
Alternative scenario: Above 6530 look for further upside with 6590 & 6660 as targets.
Comment: The RSI…
FTSE 100 > Analyses

 Thank you
Reply

TC Trader has published a new analysis.
- 75
- 597
- 54
- 3

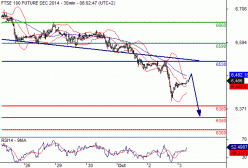
Timeframe : 30 min. - Chart + Price target(s)
Our preference: Short positions below 6530 with targets @ 6380 & 6340 in extension.
Alternative scenario: Above 6530 look for further upside with 6590 & 6660 as targets.
Comment: As long as…

