Profile of the trader trendtradingdna
GOLD - USD
> Analyses
 Thank you
Reply
Chart

trendtradingdna has published a new analysis.
- 0
- 8
- 5
- 0
Timeframe : Weekly - Chart + Trading signal
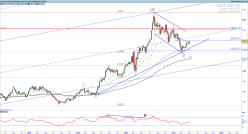
$XAUUSD is within the striking distance of the 1800 and important level for the upside breakout higher. This weekly chart is perfect to indicate the importance of a breakout higher above this level.…
INTRASENSE
> Analyses

 Thank you
Reply
Chart

trendtradingdna has published a new analysis.
- 0
- 8
- 5
- 0

Timeframe : Daily - Simple chart
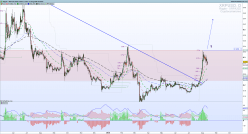
Be patient with this stock. Narrow range and a break above 0.8930 is required for a hard upside reversal. Look to short only below 0.76. Buy upon a break above 0.8930
RIPPLE - XRP/USD
> Analyses
 Thank you
Reply
Chart

trendtradingdna has published a new analysis.
- 0
- 8
- 5
- 0
Timeframe : Daily - Simple chart
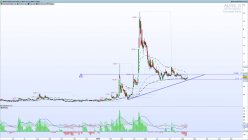
Ripple has to break above 0.32 for a complete reversal upside. This pullback should be used for a good RR entry.
EUR/USD
> Analyses

 Thank you
Reply
Chart

trendtradingdna has published a new analysis.
- 0
- 8
- 5
- 0

Timeframe : 8H - Chart + Trading signal
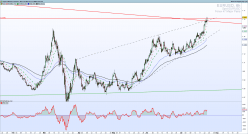
$EURUSD reached the long-term falling trend line 1.16000 resistance. We have a rising wedge overthrow and a good short trade opportunity.
GBP/USD
> Analyses

 Thank you
Reply
Chart

trendtradingdna has published a new analysis.
- 0
- 8
- 5
- 0

Timeframe : Daily - Simple chart
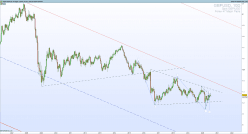
$GBPUSD is making a move inside the long term wedge by testing the1.2700 for a breakout higher and a test of 1.3000. Failure could leave lower range 1.2000 exposed
S&P500 - MINI S&P500 FULL0624
> Analyses

 Thank you
Reply
Chart

trendtradingdna has published a new analysis.
- 0
- 8
- 5
- 0

Timeframe : Daily - Chart + Trading signal
$SPX is reaching just shy of 3300 in another minor rising wedge giving us another opportunity for a short trade rather than long. Look to short with the stop loss above 3300 because reversal is in the…
EURO BUND FULL0624
> Analyses

 Thank you
Reply
Chart

trendtradingdna has published a new analysis.
- 0
- 8
- 5
- 0

Timeframe : Daily - Simple chart
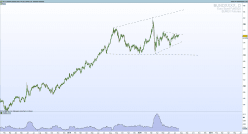
German Bund is still within a well-defined range between 174 and 176. Sill in the consolidation of a strong downside swing in March and April a positively correlated with stock market indices,…
SILVER - USD
> Analyses

 Thank you
Reply
Chart

trendtradingdna has published a new analysis.
- 0
- 8
- 5
- 0

Timeframe : Daily - Chart + Trading signal
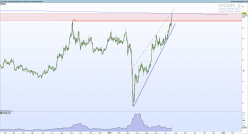
$XAGUSD/ Silver is testing the long-term resistance zone 20.400-20.60. Break above this zone is required for the upside continuation. A rejection here could lead us to a long-term range reversal to…


