LINDE AG O.N.
| Eröffnung: | - |
| Veränderung: | - |
| Volumen: | - |
| Tief: | - |
| Hoch: | - |
| Hoch - Tief: | - |
| Typ: | Aktien |
| Ticker: | LNA |
| ISIN: | DE0006483001 |
LINDE AG O.N. - Täglich - Technische Analyse auf 12.11.2016 (GMT) veröffentlicht
- Wer hat abgestimmt?
- 852
- 0
- Chart + Richtung
- Richtung : Long
- |
- Long-Positionen oberhalb von : 154,35
- Zeiteinheit : Täglich
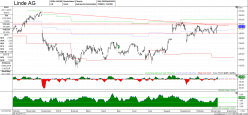

LINDE AG O.N. Chart
There is a resistance zone just above the current price starting at 154,35€ - 156,25€.
Right above this resistance zone may be a good entry point.
There is a support zone below the current price at 145,10€, a stop order could
be placed below this zone.
Seasonal to Linde is in upward trend until the beginning of 2017.
Right above this resistance zone may be a good entry point.
There is a support zone below the current price at 145,10€, a stop order could
be placed below this zone.
Seasonal to Linde is in upward trend until the beginning of 2017.
Dieses Mitglied hat nicht erklärt, ob er eine Position bei diesem Finanzinstrument hat.
Über Nutzer

Offline


Kommentar hinzufügen
Kommentare
0 Kommentare zur Analyse LINDE AG O.N. - Täglich