BITCOIN - BTC/USDT
-
USDT
(-)
- Données temps réel - Cryptocompare
| Ouverture: | - |
| Variation: | - |
| Volume: | - |
| + Bas: | - |
| + Haut: | - |
| Ecart + Bas / + Haut: | - |
| Type: | Crypto-monnaies |
| Ticker: | BTCUSDT |
| ISIN: |
BITCOIN - BTC/USDT - Bullish or bearish? Fortunately, there is no bear market in BTC at the mome - 06/04/2024 (GMT)
- Qui a voté?
- 85
- 0
- Unité de temps : Journalier

Graphique BITCOIN - BTC/USDT
Vous êtes à la recherche d'opportunités sur les crypto-monnaies?
Découvrez Lutessia Opportunities...
Découvrez Lutessia Opportunities...
Hi guys !
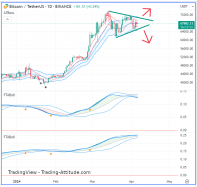
We were fearing a collapse of BTC, or a new slow downtrend, but, fortunately, it is building a daily triangle pattern.
So, what I say ? It's up or down when it will break out of the triangle.
As long as the Ftaboll(5) (the one indicator at the bottom, the longer-term one) is not entering a strong Sell Zone (see below), there is no danger.
But things can be very quick with BTC. Heads up !
Disclaimer:
This analysis is personal and does not constitute investment advice. This is a didactic interpretation based on my technical indicators. Morevover, any analysis is only valid for a certain period of time and if there is no price action of a fundamentally different nature. Do your own research and invest according to your investment horizon while managing your risk.
About the indicators used:
The A7 indicator applies to prices.
The A7 is made up of 2 "sub-indicators" which I call the red A7 (the two red lines) and the blue A7 (the 3 blue lines). Why A7? It reminded me of the A7 South of France freeway (the "Autoroute du Soleil", of course).
When the candles are surfing above the A7, we're in an uptrend. If the red A7 is surfing above the blue A7, you've got a strong trend. Conversely, if prices are surfing below the A7, we're in a downtrend.
The A7 serves as a support, a channel and a break indicator (when prices break above the upper curve of the red A7).
Black dots also indicate potential bottoms.
FTABolls are indicators below prices. Commonly used parameters are 1, 3, 4 and 5 (from shortest to longest term).
They provide a visual, multi-dimensional analysis.
A Sell Zone (colored red) is an area of potential decline, correction or loss of bearish momentum.
In a Sell Zone, where the indicator is negative, the downtrend is more pronounced.
A Safe Zone (colored green) is an area of potential upside, correction of a downtrend or loss of uptrend momentum.
In a Safe Zone where the indicator is positive, the upside is stronger.
When the FTA (the two joined lines) leaves the envelope, momentum increases.
When the FTA detaches itself from the outer envelope and re-enters it, momentum decreases.
FTABolls can be analyzed as waves at different frequencies (or wavelengths, or phases if you prefer).
When they're all in phase (positive and bullish, or negative and bearish), the probability of the movement continuing is very high.
The greater the FTA in absolute terms, the stronger the momentum. When it returns to 0, as long as it's not too rapid, this signals a drop in the strength of the current trend rather than a reversal.
Ce membre a déclaré détenir une position à l'achat sur cet instrument financier.
A propos du posteur

Hors-ligne
Analysis like no other with A7 and FTABoll ProRealTime indicators - Multidimensional analysis at a glance.


Ajouter un commentaire
Commentaires
0 commentaires sur l'analyse BITCOIN - BTC/USDT - Journalier