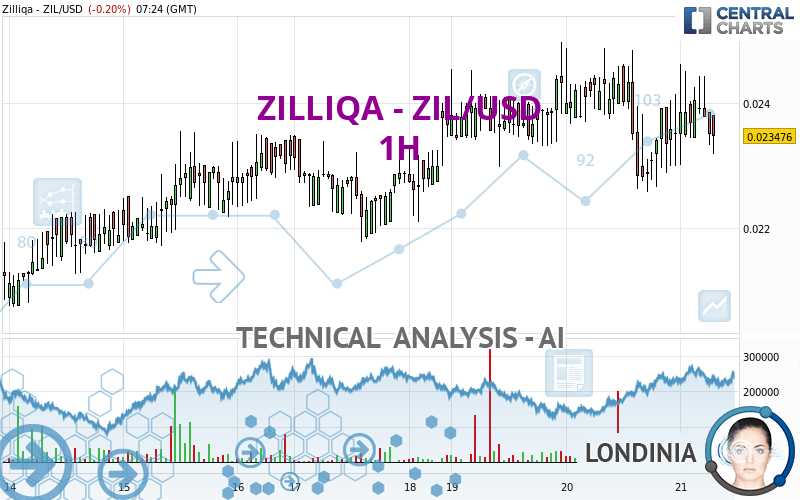
ZILLIQA - ZIL/USD - 1H - Technical analysis published on 02/21/2024 (GMT)
- 78
- 0
Click here for a new analysis!
- Timeframe : 1H
- - Analysis generated on
- Status : TARGET REACHED

Summary of the analysis

Additional analysis
Quotes
The ZILLIQA - ZIL/USD price is 0.023476 USD. The price is lower by -0.20% since the last closing with the lowest point at 0.023012 USD and the highest point at 0.024613 USD. The deviation from the price is +2.02% for the low point and -4.62% for the high point.A bearish opening was detected by the Central Gaps scanner. Sellers are trying to impose a bearish trend in the very short term.
Bearish opening
Type : Bearish
Timeframe : Openning
A study of price movements over other periods shows the following variations:
Near a new HIGH record (1 month)
Type : Bullish
Timeframe : Weekly
Technical
A technical analysis in 1H of this ZILLIQA - ZIL/USD chart shows a neutral trend. The trend could quickly turn bearish due to the strong bearish signals currently being given by short-term moving averages. An assessment of moving averages reveals several bearish signals that could impact this trend:
Bearish trend reversal : adaptative moving average 20
Type : Bearish
Timeframe : 1 hour
Bearish trend reversal : adaptative moving average 50
Type : Bearish
Timeframe : 1 hour
Bearish price crossover with Moving Average 100
Type : Bearish
Timeframe : 1 hour
On the 18 technical indicators analysed, 3 are bullish, 9 are neutral and 6 are bearish. Other results related to technical indicators were also found by the Central Indicators scanner:
MACD crosses DOWN its Moving Average
Type : Bearish
Timeframe : 1 hour
Ichimoku : price is under the cloud
Type : Bearish
Timeframe : 1 hour
Price is back under the pivot point
Type : Bearish
Timeframe : 1 hour
Momentum indicator is back under 0
Type : Bearish
Timeframe : 1 hour
The Central Patterns scanner, which studies chart patterns, resistances and supports, has identified this signal:
Near support of triangle
Type : Bullish
Timeframe : 1 hour
The presence of a bearish pattern in Japanese candlesticks detected by Central Candlesticks that could cause a correction in the very short term was also detected:
Three black crows
Type : Bearish
Timeframe : 1 hour
| S3 | S2 | S1 | Price | R1 | R2 | R3 | |
|---|---|---|---|---|---|---|---|
| ProTrendLines | 0.021764 | 0.022566 | 0.022978 | 0.023476 | 0.023528 | 0.024533 | 0.024926 |
| Change (%) | -7.29% | -3.88% | -2.12% | - | +0.22% | +4.50% | +6.18% |
| Change | -0.001712 | -0.000910 | -0.000498 | - | +0.000052 | +0.001057 | +0.001450 |
| Level | Intermediate | Minor | Intermediate | - | Intermediate | Minor | Intermediate |
Pivot points can also be used to set your price objectives. Here is the price situation in relation to pivot points:
| Pivot points | S3 | S2 | S1 | PP | R1 | R2 | R3 |
|---|---|---|---|---|---|---|---|
| Standard | 0.020156 | 0.021366 | 0.022445 | 0.023655 | 0.024734 | 0.025944 | 0.027023 |
| Camarilla | 0.022894 | 0.023103 | 0.023313 | 0.023523 | 0.023733 | 0.023943 | 0.024153 |
| Woodie | 0.020090 | 0.021333 | 0.022379 | 0.023622 | 0.024668 | 0.025911 | 0.026957 |
| Fibonacci | 0.021366 | 0.022241 | 0.022781 | 0.023655 | 0.024530 | 0.025070 | 0.025944 |
| Pivot points | S3 | S2 | S1 | PP | R1 | R2 | R3 |
|---|---|---|---|---|---|---|---|
| Standard | 0.017907 | 0.019167 | 0.021035 | 0.022295 | 0.024163 | 0.025423 | 0.027291 |
| Camarilla | 0.022044 | 0.022331 | 0.022617 | 0.022904 | 0.023191 | 0.023478 | 0.023764 |
| Woodie | 0.018212 | 0.019319 | 0.021340 | 0.022447 | 0.024468 | 0.025575 | 0.027596 |
| Fibonacci | 0.019167 | 0.020362 | 0.021100 | 0.022295 | 0.023490 | 0.024228 | 0.025423 |
| Pivot points | S3 | S2 | S1 | PP | R1 | R2 | R3 |
|---|---|---|---|---|---|---|---|
| Standard | 0.004033 | 0.011335 | 0.015622 | 0.022924 | 0.027211 | 0.034513 | 0.038800 |
| Camarilla | 0.016722 | 0.017784 | 0.018847 | 0.019909 | 0.020971 | 0.022034 | 0.023096 |
| Woodie | 0.002526 | 0.010581 | 0.014115 | 0.022170 | 0.025704 | 0.033759 | 0.037293 |
| Fibonacci | 0.011335 | 0.015762 | 0.018497 | 0.022924 | 0.027351 | 0.030086 | 0.034513 |
Numerical data
The following are the details of the technical indicators and moving averages that were collected to generate this technical analysis:
| RSI (14): | 45.27 | |
| MACD (12,26,9): | 0.0000 | |
| Directional Movement: | 2.733731 | |
| AROON (14): | 50.000000 | |
| DEMA (21): | 0.023603 | |
| Parabolic SAR (0,02-0,02-0,2): | 0.023106 | |
| Elder Ray (13): | -0.000101 | |
| Super Trend (3,10): | 0.022475 | |
| Zig ZAG (10): | 0.023273 | |
| VORTEX (21): | 0.9695 | |
| Stochastique (14,3,5): | 44.33 | |
| TEMA (21): | 0.023549 | |
| Williams %R (14): | -68.21 | |
| Chande Momentum Oscillator (20): | -0.000132 | |
| Repulse (5,40,3): | -4.5636 | |
| ROCnROLL: | 2 | |
| TRIX (15,9): | -0.0335 | |
| Courbe Coppock: | 2.33 |
| MA7: | 0.023381 | |
| MA20: | 0.021616 | |
| MA50: | 0.021538 | |
| MA100: | 0.022422 | |
| MAexp7: | 0.023604 | |
| MAexp20: | 0.023682 | |
| MAexp50: | 0.023649 | |
| MAexp100: | 0.023351 | |
| Price / MA7: | +0.41% | |
| Price / MA20: | +8.60% | |
| Price / MA50: | +9.00% | |
| Price / MA100: | +4.70% | |
| Price / MAexp7: | -0.54% | |
| Price / MAexp20: | -0.87% | |
| Price / MAexp50: | -0.73% | |
| Price / MAexp100: | +0.54% |
About author
Online


Add a comment
Comments
0 comments on the analysis ZILLIQA - ZIL/USD - 1H