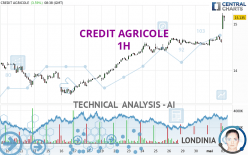
CREDIT AGRICOLE - 1H - Technical analysis published on 05/03/2024 (GMT)
- 75
- 0
Click here for a new analysis!
- Timeframe : 1H
- - Analysis generated on
- Status : LEVEL MAINTAINED

Summary of the analysis

Additional analysis
Quotes
CREDIT AGRICOLE rating 15.105 EUR. The price registered an increase of +3.39% on the session with the lowest point at 14.885 EUR and the highest point at 15.230 EUR. The deviation from the price is +1.48% for the low point and -0.82% for the high point.The Central Gaps scanner detects a bullish gap which is a sign that buyers have taken the lead in the very short term.
Opening Gap UP
Type : Bullish
Timeframe : Openning
A study of price movements over other periods shows the following variations:
New HIGH record (5 years)
Type : Bullish
Timeframe : Weekly
New HIGH record (1 year)
Type : Bullish
Timeframe : Weekly
New HIGH record (1st january)
Type : Bullish
Timeframe : Weekly
New HIGH record (1 month)
Type : Bullish
Timeframe : Weekly
Technical
A technical analysis in 1H of this CREDIT AGRICOLE chart shows a strongly bullish trend. The signals given by the moving averages are 92.86% bullish. This strong bullish trend is confirmed by the strong signals currently being given by short-term moving averages. There is no crossing of moving average by the price or crossing of moving averages between themselves.
An assessment of technical indicators shows a strong bullish signal.
But beware of excesses. The Central Indicators scanner currently detects this:
RSI indicator is overbought : over 70
Type : Neutral
Timeframe : 1 hour
CCI indicator is overbought : over 100
Type : Neutral
Timeframe : 1 hour
Previous candle closed over Bollinger bands
Type : Neutral
Timeframe : 1 hour
Williams %R indicator is overbought : over -20
Type : Neutral
Timeframe : 1 hour
Pivot points : price is over resistance 1
Type : Neutral
Timeframe : Weekly
Pivot points : price is over resistance 3
Type : Neutral
Timeframe : 1 hour
The Central Patterns scanner, which studies chart patterns, resistances and supports, has identified these signals:
Near horizontal resistance
Type : Bearish
Timeframe : 1 hour
Resistance of channel is broken
Type : Bullish
Timeframe : 1 hour
Central Candlesticks, the scanner specialised in Japanese candlesticks, detects a bearish signal that could support the hypothesis of a small drop in the very short term:
Bearish harami
Type : Bearish
Timeframe : 1 hour
| S3 | S2 | S1 | Price | |
|---|---|---|---|---|
| ProTrendLines | 14.240 | 14.555 | 14.700 | 15.105 |
| Change (%) | -5.73% | -3.64% | -2.68% | - |
| Change | -0.865 | -0.550 | -0.405 | - |
| Level | Intermediate | Minor | Intermediate | - |
Pivot points can also be used to set your price objectives. Here is the price situation in relation to pivot points:
| Pivot points | S3 | S2 | S1 | PP | R1 | R2 | R3 |
|---|---|---|---|---|---|---|---|
| Standard | 14.285 | 14.410 | 14.510 | 14.635 | 14.735 | 14.860 | 14.960 |
| Camarilla | 14.548 | 14.569 | 14.589 | 14.610 | 14.631 | 14.651 | 14.672 |
| Woodie | 14.273 | 14.404 | 14.498 | 14.629 | 14.723 | 14.854 | 14.948 |
| Fibonacci | 14.410 | 14.496 | 14.549 | 14.635 | 14.721 | 14.774 | 14.860 |
| Pivot points | S3 | S2 | S1 | PP | R1 | R2 | R3 |
|---|---|---|---|---|---|---|---|
| Standard | 13.520 | 13.785 | 14.170 | 14.435 | 14.820 | 15.085 | 15.470 |
| Camarilla | 14.376 | 14.436 | 14.495 | 14.555 | 14.615 | 14.674 | 14.734 |
| Woodie | 13.580 | 13.815 | 14.230 | 14.465 | 14.880 | 15.115 | 15.530 |
| Fibonacci | 13.785 | 14.033 | 14.187 | 14.435 | 14.683 | 14.837 | 15.085 |
| Pivot points | S3 | S2 | S1 | PP | R1 | R2 | R3 |
|---|---|---|---|---|---|---|---|
| Standard | 12.550 | 13.010 | 13.780 | 14.240 | 15.010 | 15.470 | 16.240 |
| Camarilla | 14.212 | 14.325 | 14.437 | 14.550 | 14.663 | 14.776 | 14.888 |
| Woodie | 12.705 | 13.088 | 13.935 | 14.318 | 15.165 | 15.548 | 16.395 |
| Fibonacci | 13.010 | 13.480 | 13.770 | 14.240 | 14.710 | 15.000 | 15.470 |
Numerical data
The following is the status of the technical indicators and moving averages at the time of publication of this technical analysis:
| RSI (14): | 72.94 | |
| MACD (12,26,9): | 0.0950 | |
| Directional Movement: | 39.989 | |
| AROON (14): | 64.286 | |
| DEMA (21): | 14.824 | |
| Parabolic SAR (0,02-0,02-0,2): | 14.590 | |
| Elder Ray (13): | 0.347 | |
| Super Trend (3,10): | 14.784 | |
| Zig ZAG (10): | 15.095 | |
| VORTEX (21): | 1.1310 | |
| Stochastique (14,3,5): | 67.47 | |
| TEMA (21): | 14.872 | |
| Williams %R (14): | -21.58 | |
| Chande Momentum Oscillator (20): | 0.500 | |
| Repulse (5,40,3): | 0.8090 | |
| ROCnROLL: | 1 | |
| TRIX (15,9): | 0.0420 | |
| Courbe Coppock: | 3.49 |
| MA7: | 14.612 | |
| MA20: | 14.188 | |
| MA50: | 13.502 | |
| MA100: | 13.209 | |
| MAexp7: | 14.860 | |
| MAexp20: | 14.719 | |
| MAexp50: | 14.585 | |
| MAexp100: | 14.403 | |
| Price / MA7: | +3.37% | |
| Price / MA20: | +6.46% | |
| Price / MA50: | +11.87% | |
| Price / MA100: | +14.35% | |
| Price / MAexp7: | +1.65% | |
| Price / MAexp20: | +2.62% | |
| Price / MAexp50: | +3.57% | |
| Price / MAexp100: | +4.87% |
News
Don't forget to follow the news on CREDIT AGRICOLE. At the time of publication of this analysis, the latest news was as follows:
- CREDIT AGRICOLE SA: Q1-2024 Results : THE GROUP CONTINUES TO GROW
- Release of the 2023 Credit Agricole Assurances group’s SFCR
- CREDIT AGRICOLE SA: Availability of Crédit Agricole S.A.’s 2023 Universal Registration Document and Annual Financial Report
- Crédit Agricole S.A. announces the reduction of its share capital through the cancellation of treasury shares purchased under a share repurchase program
- CREDIT AGRICOLE SA: Fourth quarter and full-year 2023 - VERY GOOD RESULTS IN 2023
About author

Online


Add a comment
Comments
0 comments on the analysis CREDIT AGRICOLE - 1H