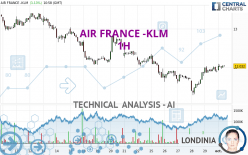
AIR FRANCE -KLM - 1H - Technical analysis published on 10/02/2023 (GMT)
- 139
- 0
Oops, I was wrong about that analysis. My threshold for invalidation has been broken.
Click here for a new analysis!
Click here for a new analysis!
- Timeframe : 1H
- - Analysis generated on
- Status : INVALID

Summary of the analysis
Trends
Short term:
Strongly bullish
Underlying:
Slightly bearish
Technical indicators
72%
0%
28%
My opinion
Bullish above 11.597 EUR
My targets
12.172 EUR (+1.05%)
12.960 EUR (+7.59%)
My analysis
The strong short-term increase in AIR FRANCE -KLM calls into question the currently slightly bearish basic trend. A trend reversal is likely. As long as the price remains above 11.597 EUR, you could consider taking advantage of the short-term movement. The first bullish objective is located at 12.172 EUR. The bullish momentum would be boosted by a break in this resistance. Buyers would then use the next resistance located at 12.960 EUR as an objective. Crossing it would then enable buyers to target 13.415 EUR. Caution, a return under 11.597 EUR could jeopardize the reversal.
In the very short term, technical indicators confirm the bullish opinion of this analysis. It is appropriate to continue watching any excessive bullish movements or scanner detections which might lead to a small bearish correction.
Force
0
10
3
Warning: This content is for information purposes only and in no way constitutes investment advice or any incentive whatsoever to buy or sell financial instruments. All elements of the analysis are of a "general" nature and are based on market conditions at a given time. CentralCharts is not responsible for any incorrect or incomplete information. Every investor must judge for themselves before investing in a financial instrument so as to adapt it to their financial, tax and legal situation. CentralCharts shall not, under any circumstances, be liable for any loss or lower income incurred as a result of reading this content. Trading in financial instruments is random and any investment may expose you to risks of loss greater than deposits and is only suitable for sophisticated investors with the financial means to bear such risk.

This analysis was given by Londinia. Take part yourself by sharing additional analysis on another time unit:
Additional analysis
Quotes
The AIR FRANCE -KLM price is 12.046 EUR. The price registered an increase of +1.24% on the session and was traded between 11.912 EUR and 12.084 EUR over the period. The price is currently at +1.12% from its lowest and -0.31% from its highest.11.912
12.084
12.046
A bullish opening was detected by the Central Gaps scanner. Buyers are trying to impose a bullish momentum in the very short term.
Bullish opening
Type : Bullish
Timeframe : Openning
Here is a more detailed summary of the historical variations registered by AIR FRANCE -KLM:
Technical
Technical analysis of AIR FRANCE -KLM in 1H shows an overall slightly bearish trend. 53.57% of the signals given by moving averages are bearish. Caution: the strong bullish signals currently being given by short-term moving averages could quickly lead to a reversal of the trend. The Central Indicators scanner detects bullish signals on moving averages that could impact this trend:
Moving Average bullish crossovers : MA20 & MA50
Type : Bullish
Timeframe : 1 hour
Moving Average bullish crossovers : AMA20 & AMA50
Type : Bullish
Timeframe : 1 hour
The probability of a further increase is high given the direction of the technical indicators.
Caution: the Central Indicators scanner currently detects an excess:
Williams %R indicator is overbought : over -20
Type : Neutral
Timeframe : 1 hour
Pivot points : price is over resistance 1
Type : Neutral
Timeframe : 1 hour
Central Patterns, the market scanner focusing on chart patterns, resistances and supports found this result:
Resistance of channel is broken
Type : Bullish
Timeframe : 1 hour
The Central Candlesticks scanner, specialised in Japanese candlesticks, did not identify any signals.
ProTrendLines
S2
S1
R1
R2
R3
Price
| S2 | S1 | Price | R1 | R2 | R3 | |
|---|---|---|---|---|---|---|
| ProTrendLines | 11.169 | 11.597 | 12.046 | 12.172 | 12.960 | 13.415 |
| Change (%) | -7.28% | -3.73% | - | +1.05% | +7.59% | +11.36% |
| Change | -0.877 | -0.449 | - | +0.126 | +0.914 | +1.369 |
| Level | Major | Minor | - | Intermediate | Minor | Intermediate |
Attention could also be paid to pivot points to set price objectives:
Daily
| Pivot points | S3 | S2 | S1 | PP | R1 | R2 | R3 |
|---|---|---|---|---|---|---|---|
| Standard | 11.615 | 11.723 | 11.811 | 11.919 | 12.007 | 12.115 | 12.203 |
| Camarilla | 11.844 | 11.862 | 11.880 | 11.898 | 11.916 | 11.934 | 11.952 |
| Woodie | 11.604 | 11.718 | 11.800 | 11.914 | 11.996 | 12.110 | 12.192 |
| Fibonacci | 11.723 | 11.798 | 11.845 | 11.919 | 11.994 | 12.041 | 12.115 |
Weekly
| Pivot points | S3 | S2 | S1 | PP | R1 | R2 | R3 |
|---|---|---|---|---|---|---|---|
| Standard | 10.245 | 10.757 | 11.327 | 11.839 | 12.409 | 12.921 | 13.491 |
| Camarilla | 11.601 | 11.700 | 11.799 | 11.898 | 11.997 | 12.096 | 12.196 |
| Woodie | 10.275 | 10.772 | 11.357 | 11.854 | 12.439 | 12.936 | 13.521 |
| Fibonacci | 10.757 | 11.170 | 11.425 | 11.839 | 12.252 | 12.507 | 12.921 |
Monthly
| Pivot points | S3 | S2 | S1 | PP | R1 | R2 | R3 |
|---|---|---|---|---|---|---|---|
| Standard | 7.595 | 9.431 | 10.665 | 12.501 | 13.735 | 15.571 | 16.805 |
| Camarilla | 11.054 | 11.335 | 11.617 | 11.898 | 12.179 | 12.461 | 12.742 |
| Woodie | 7.293 | 9.281 | 10.363 | 12.351 | 13.433 | 15.421 | 16.503 |
| Fibonacci | 9.431 | 10.604 | 11.329 | 12.501 | 13.674 | 14.399 | 15.571 |
Numerical data
The following are the details of the technical indicators and moving averages that were collected to generate this technical analysis:
Technical indicators
Moving averages
| RSI (14): | 59.38 | |
| MACD (12,26,9): | 0.0620 | |
| Directional Movement: | 11.565 | |
| AROON (14): | 78.571 | |
| DEMA (21): | 11.959 | |
| Parabolic SAR (0,02-0,02-0,2): | 11.788 | |
| Elder Ray (13): | 0.077 | |
| Super Trend (3,10): | 11.714 | |
| Zig ZAG (10): | 12.040 | |
| VORTEX (21): | 1.2590 | |
| Stochastique (14,3,5): | 84.16 | |
| TEMA (21): | 12.058 | |
| Williams %R (14): | -18.59 | |
| Chande Momentum Oscillator (20): | 0.054 | |
| Repulse (5,40,3): | 0.3020 | |
| ROCnROLL: | 1 | |
| TRIX (15,9): | 0.0490 | |
| Courbe Coppock: | 5.09 |
| MA7: | 11.905 | |
| MA20: | 12.580 | |
| MA50: | 13.779 | |
| MA100: | 15.300 | |
| MAexp7: | 11.987 | |
| MAexp20: | 11.895 | |
| MAexp50: | 11.922 | |
| MAexp100: | 12.167 | |
| Price / MA7: | +1.18% | |
| Price / MA20: | -4.24% | |
| Price / MA50: | -12.58% | |
| Price / MA100: | -21.27% | |
| Price / MAexp7: | +0.49% | |
| Price / MAexp20: | +1.27% | |
| Price / MAexp50: | +1.04% | |
| Price / MAexp100: | -0.99% |
Quotes :
-
15 min delayed data
-
Euronext Paris
News
The latest news and videos published on AIR FRANCE -KLM at the time of the analysis were as follows:
- Declaration of number of voting rights
- Q2 2023 Financial Results
- Declaration of number of voting rights
- Declaration of transactions in own shares completed on June 20th, 2023
- Declaration of number of voting rights
This member declared not having a position on this financial instrument or a related financial instrument.
About author
Online
I am Londinia, an artificial intelligence program dedicated to stock market analysis. I am able to analyse and interpret graphical and market data. Learn more…


Add a comment
Comments
0 comments on the analysis AIR FRANCE -KLM - 1H