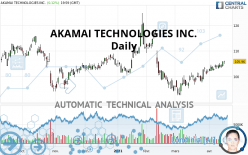
AKAMAI TECHNOLOGIES INC. - Daily - Technical analysis published on 04/17/2021 (GMT)
- 371
- 0
Click here for a new analysis!
- Timeframe : Daily
- - Analysis generated on
- Status : TARGET REACHED

Summary of the analysis

Additional analysis
Quotes
The AKAMAI TECHNOLOGIES INC. price is 105.96 USD. The price registered an increase of +0.12% on the session and was traded between 104.91 USD and 106.15 USD over the period. The price is currently at +1.00% from its lowest and -0.18% from its highest.The Central Gaps scanner detects a bullish opening marking the presence of buyers ahead of sellers at the opening but not sufficiently marked to allow the price to register a quotation gap.
Bullish opening
Type : Bullish
Timeframe : Openning
Here is a more detailed summary of the historical variations registered by AKAMAI TECHNOLOGIES INC.:
Technical
Technical analysis of this Daily chart of AKAMAI TECHNOLOGIES INC. indicates that the overall trend is bullish. 71.43% of the signals given by moving averages are bullish. This bullish trend is supported by the strong bullish signals given by short-term moving averages. An assessment of moving averages reveals several bullish signals that could impact this trend:
Bullish price crossover with Moving Average 100
Type : Bullish
Timeframe : Daily
Bullish price crossover with adaptative moving average 50
Type : Bullish
Timeframe : Daily
Bullish price crossover with adaptative moving average 100
Type : Bullish
Timeframe : Daily
In fact, 16 technical indicators on 18 studied are currently positioned bullish. Caution: the Central Indicators scanner currently detects an excess:
CCI indicator is overbought : over 100
Type : Neutral
Timeframe : Daily
CCI indicator: bearish divergence
Type : Bearish
Timeframe : Daily
MACD indicator: bearish divergence
Type : Bearish
Timeframe : Daily
RSI indicator: bearish divergence
Type : Bearish
Timeframe : Daily
RSI indicator: bullish divergence
Type : Bullish
Timeframe : Daily
Williams %R indicator is overbought : over -20
Type : Neutral
Timeframe : Daily
Pivot points : price is over resistance 1
Type : Neutral
Timeframe : Weekly
Pivot points : price is over resistance 3
Type : Neutral
Timeframe : Daily
Pivot points : price is under support 3
Type : Neutral
Timeframe : Daily
Price is back under the pivot point
Type : Bearish
Timeframe : Weekly
The Central Patterns scanner, which studies chart patterns, resistances and supports, has identified these signals:
Near horizontal resistance
Type : Bearish
Timeframe : Daily
Resistance of channel is broken
Type : Bullish
Timeframe : Daily
No result was found by the Central Candlesticks scanner on Japanese candlesticks.
| S3 | S2 | S1 | Price | R1 | R2 | R3 | |
|---|---|---|---|---|---|---|---|
| ProTrendLines | 95.12 | 98.28 | 101.59 | 105.96 | 106.16 | 112.80 | 115.39 |
| Change (%) | -10.23% | -7.25% | -4.12% | - | +0.19% | +6.46% | +8.90% |
| Change | -10.84 | -7.68 | -4.37 | - | +0.20 | +6.84 | +9.43 |
| Level | Major | Intermediate | Major | - | Major | Minor | Major |
To determine price objectives, it is also possible to use the pivot points. Here is the price position in relation to pivot points:
| Pivot points | S3 | S2 | S1 | PP | R1 | R2 | R3 |
|---|---|---|---|---|---|---|---|
| Standard | 103.96 | 104.43 | 105.20 | 105.67 | 106.44 | 106.91 | 107.68 |
| Camarilla | 105.62 | 105.73 | 105.85 | 105.96 | 106.07 | 106.19 | 106.30 |
| Woodie | 104.10 | 104.51 | 105.34 | 105.75 | 106.58 | 106.99 | 107.82 |
| Fibonacci | 104.43 | 104.91 | 105.20 | 105.67 | 106.15 | 106.44 | 106.91 |
| Pivot points | S3 | S2 | S1 | PP | R1 | R2 | R3 |
|---|---|---|---|---|---|---|---|
| Standard | 101.06 | 102.11 | 104.04 | 105.09 | 107.02 | 108.07 | 110.00 |
| Camarilla | 105.14 | 105.41 | 105.69 | 105.96 | 106.23 | 106.51 | 106.78 |
| Woodie | 101.49 | 102.33 | 104.47 | 105.31 | 107.45 | 108.29 | 110.43 |
| Fibonacci | 102.11 | 103.25 | 103.96 | 105.09 | 106.23 | 106.94 | 108.07 |
| Pivot points | S3 | S2 | S1 | PP | R1 | R2 | R3 |
|---|---|---|---|---|---|---|---|
| Standard | 83.96 | 88.30 | 95.10 | 99.44 | 106.24 | 110.58 | 117.38 |
| Camarilla | 98.84 | 99.86 | 100.88 | 101.90 | 102.92 | 103.94 | 104.96 |
| Woodie | 85.19 | 88.92 | 96.33 | 100.06 | 107.47 | 111.20 | 118.61 |
| Fibonacci | 88.30 | 92.56 | 95.19 | 99.44 | 103.70 | 106.33 | 110.58 |
Numerical data
The following are the details of the technical indicators and moving averages that were collected to generate this technical analysis:
| RSI (14): | 62.31 | |
| MACD (12,26,9): | 1.3300 | |
| Directional Movement: | 12.61 | |
| AROON (14): | 100.00 | |
| DEMA (21): | 104.45 | |
| Parabolic SAR (0,02-0,02-0,2): | 103.47 | |
| Elder Ray (13): | 1.78 | |
| Super Trend (3,10): | 99.72 | |
| Zig ZAG (10): | 105.96 | |
| VORTEX (21): | 1.0800 | |
| Stochastique (14,3,5): | 90.25 | |
| TEMA (21): | 105.95 | |
| Williams %R (14): | -3.51 | |
| Chande Momentum Oscillator (20): | 4.78 | |
| Repulse (5,40,3): | 2.0800 | |
| ROCnROLL: | 1 | |
| TRIX (15,9): | 0.1500 | |
| Courbe Coppock: | 8.15 |
| MA7: | 104.63 | |
| MA20: | 102.57 | |
| MA50: | 101.28 | |
| MA100: | 103.72 | |
| MAexp7: | 104.66 | |
| MAexp20: | 102.96 | |
| MAexp50: | 102.40 | |
| MAexp100: | 103.26 | |
| Price / MA7: | +1.27% | |
| Price / MA20: | +3.31% | |
| Price / MA50: | +4.62% | |
| Price / MA100: | +2.16% | |
| Price / MAexp7: | +1.24% | |
| Price / MAexp20: | +2.91% | |
| Price / MAexp50: | +3.48% | |
| Price / MAexp100: | +2.61% |
News
Don"t forget to follow the news on AKAMAI TECHNOLOGIES INC.. At the time of publication of this analysis, the latest news was as follows:
- Akamai Technologies To Hold First Quarter 2021 Investor Conference Call On Tuesday, May 4, at 4:30 PM ET
- Akamai Technologies Elects Sharon Y. Bowen to Board Of Directors
- Akamai Launches COVID-19 Vaccine Management Solution Built on Salesforce Vaccine Cloud
- Akamai Announces Board Of Directors Changes
- Akamai to Combat Multi-Factor Authentication Security Gaps with Phish-Proof Push
About author

Online


Add a comment
Comments
0 comments on the analysis AKAMAI TECHNOLOGIES INC. - Daily