GRIFOLS - 1H - Technical analysis published on 10/02/2023 (GMT)
- 133
- 0
I am delighted to see that my first price objective has been achieved. I hope you've taken advantage of it.
Click here for a new analysis!
Click here for a new analysis!
- Timeframe : 1H
- - Analysis generated on
- Status : TARGET REACHED
Summary of the analysis
Trends
Short term:
Neutral
Underlying:
Bearish
Technical indicators
22%
33%
44%
My opinion
Bearish under 12.686 EUR
My targets
12.137 EUR (-1.08%)
11.850 EUR (-3.42%)
My analysis
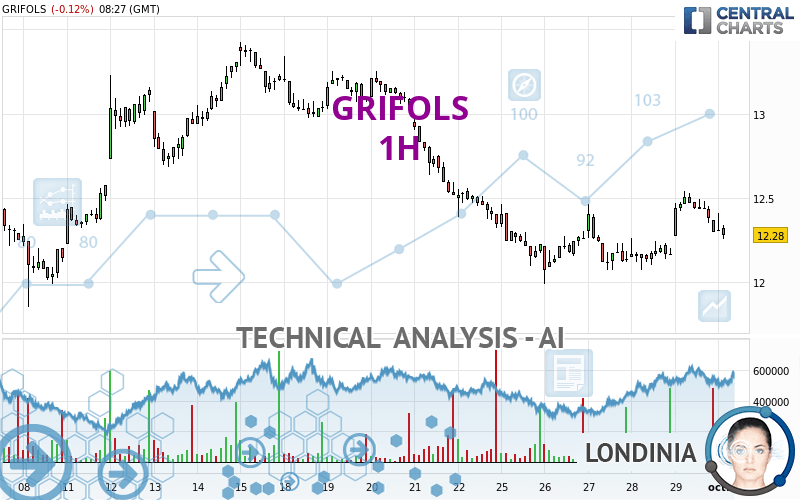
We are currently in a phase of short-term indecision. In a case like this, you could favour trades in the direction of the basic trend on GRIFOLS. As long as you are under the resistance located at 12.686 EUR, traders with an aggressive trading strategy could consider a sale. A cross of the support located at 12.137 EUR would be a signal of a reversal in the basic trend and the short-term trend could then quickly become bearish. Sellers would then use the next support located at 11.850 EUR as an objective. Crossing it would then enable sellers to target 11.456 EUR. If the resistance 12.686 EUR were to be broken, this would simply be a sign of possible further short-term consolidation and trading against this trend would then perhaps be more risky.
Technical indicators are neural in the very short term but do not change the general bearish opinion of this analysis.
Force
0
10
4.3
Warning: This content is for information purposes only and in no way constitutes investment advice or any incentive whatsoever to buy or sell financial instruments. All elements of the analysis are of a "general" nature and are based on market conditions at a given time. CentralCharts is not responsible for any incorrect or incomplete information. Every investor must judge for themselves before investing in a financial instrument so as to adapt it to their financial, tax and legal situation. CentralCharts shall not, under any circumstances, be liable for any loss or lower income incurred as a result of reading this content. Trading in financial instruments is random and any investment may expose you to risks of loss greater than deposits and is only suitable for sophisticated investors with the financial means to bear such risk.

This analysis was given by Londinia. Take part yourself by sharing additional analysis on another time unit:
Additional analysis
Quotes
GRIFOLS rating 12.270 EUR. On the day, this instrument lost -0.20% and was between 12.255 EUR and 12.410 EUR. This implies that the price is at +0.12% from its lowest and at -1.13% from its highest.12.255
12.410
12.270
So that you have an overall view of the price change, here is a table showing the variations over several periods:
Near a new LOW record (1 month)
Type : Bearish
Timeframe : Weekly
Technical
Technical analysis of GRIFOLS in 1H shows an overall bearish trend. 78.57% of the signals given by moving averages are bearish. Caution: the neutral signals currently given by short-term moving averages show us that the global trend is losing momentum. The Central Indicators market scanner is currently detecting several bearish signals that could impact this trend:
Bearish price crossover with Moving Average 20
Type : Bearish
Timeframe : 1 hour
Bearish price crossover with adaptative moving average 20
Type : Bearish
Timeframe : 1 hour
The technical indicators are generally neutral. They do not provide relevant information on the direction of future price movements.
Central Indicators, the detector scanner for these technical indicators has recently detected several signals:
MACD crosses DOWN its Moving Average
Type : Bearish
Timeframe : 1 hour
Parabolic SAR indicator bearish reversal
Type : Bearish
Timeframe : 1 hour
Ichimoku : price is under the cloud
Type : Bearish
Timeframe : 1 hour
Central Patterns, the scanner specializing in chart patterns, did not identify any signals.
The Central Candlesticks scanner, specialised in Japanese candlesticks, did not identify any signals.
ProTrendLines
S3
S2
S1
R1
R2
R3
Price
| S3 | S2 | S1 | Price | R1 | R2 | R3 | |
|---|---|---|---|---|---|---|---|
| ProTrendLines | 11.850 | 12.137 | 12.263 | 12.270 | 12.686 | 12.940 | 13.315 |
| Change (%) | -3.42% | -1.08% | -0.06% | - | +3.39% | +5.46% | +8.52% |
| Change | -0.420 | -0.133 | -0.007 | - | +0.416 | +0.670 | +1.045 |
| Level | Intermediate | Major | Minor | - | Minor | Minor | Major |
Attention could also be paid to pivot points to set price objectives:
Daily
| Pivot points | S3 | S2 | S1 | PP | R1 | R2 | R3 |
|---|---|---|---|---|---|---|---|
| Standard | 11.927 | 12.098 | 12.197 | 12.368 | 12.467 | 12.638 | 12.737 |
| Camarilla | 12.221 | 12.246 | 12.270 | 12.295 | 12.320 | 12.345 | 12.369 |
| Woodie | 11.890 | 12.080 | 12.160 | 12.350 | 12.430 | 12.620 | 12.700 |
| Fibonacci | 12.098 | 12.202 | 12.265 | 12.368 | 12.472 | 12.535 | 12.638 |
Weekly
| Pivot points | S3 | S2 | S1 | PP | R1 | R2 | R3 |
|---|---|---|---|---|---|---|---|
| Standard | 11.452 | 11.718 | 12.007 | 12.273 | 12.562 | 12.828 | 13.117 |
| Camarilla | 12.142 | 12.193 | 12.244 | 12.295 | 12.346 | 12.397 | 12.448 |
| Woodie | 11.463 | 11.724 | 12.018 | 12.279 | 12.573 | 12.834 | 13.128 |
| Fibonacci | 11.718 | 11.930 | 12.061 | 12.273 | 12.485 | 12.616 | 12.828 |
Monthly
| Pivot points | S3 | S2 | S1 | PP | R1 | R2 | R3 |
|---|---|---|---|---|---|---|---|
| Standard | 10.047 | 10.948 | 11.622 | 12.523 | 13.197 | 14.098 | 14.772 |
| Camarilla | 11.862 | 12.006 | 12.151 | 12.295 | 12.439 | 12.584 | 12.728 |
| Woodie | 9.933 | 10.891 | 11.508 | 12.466 | 13.083 | 14.041 | 14.658 |
| Fibonacci | 10.948 | 11.550 | 11.922 | 12.523 | 13.125 | 13.497 | 14.098 |
Numerical data
The following are the details of the technical indicators and moving averages that were collected to generate this technical analysis:
Technical indicators
Moving averages
| RSI (14): | 46.22 | |
| MACD (12,26,9): | 0.0250 | |
| Directional Movement: | 0.234 | |
| AROON (14): | 28.571 | |
| DEMA (21): | 12.347 | |
| Parabolic SAR (0,02-0,02-0,2): | 12.540 | |
| Elder Ray (13): | -0.040 | |
| Super Trend (3,10): | 12.224 | |
| Zig ZAG (10): | 12.270 | |
| VORTEX (21): | 0.9940 | |
| Stochastique (14,3,5): | 39.88 | |
| TEMA (21): | 12.399 | |
| Williams %R (14): | -66.67 | |
| Chande Momentum Oscillator (20): | 0.105 | |
| Repulse (5,40,3): | -1.4950 | |
| ROCnROLL: | 2 | |
| TRIX (15,9): | 0.0400 | |
| Courbe Coppock: | 3.34 |
| MA7: | 12.241 | |
| MA20: | 12.607 | |
| MA50: | 12.892 | |
| MA100: | 12.352 | |
| MAexp7: | 12.337 | |
| MAexp20: | 12.318 | |
| MAexp50: | 12.356 | |
| MAexp100: | 12.488 | |
| Price / MA7: | +0.24% | |
| Price / MA20: | -2.67% | |
| Price / MA50: | -4.82% | |
| Price / MA100: | -0.66% | |
| Price / MAexp7: | -0.54% | |
| Price / MAexp20: | -0.39% | |
| Price / MAexp50: | -0.70% | |
| Price / MAexp100: | -1.75% |
Quotes :
-
15 min delayed data
-
Spain Stocks
News
The last news published on GRIFOLS at the time of the generation of this analysis was as follows:
- Grifols Accelerates Healthcare Innovation with Google Cloud’s AI and Analytics
- Grifols Achieves Positive Topline Results From Phase 4 Study of XEMBIFY® (immune globulin subcutaneous human-klhw) Evaluating Biweekly Dosing Option for Patients
- Grifols Completes Enrollment in Phase 3 Study of Long-term Albutein® (albumin-human injection) Therapy for Patients with Decompensated Cirrhosis
- Grifols Meets Enrollment Target in Phase 3 Study of Two Dose Regimens of Prolastin®-C in Patients with Emphysema Due to Alpha-1-Antitrypsin Deficiency
- Grifols Launches AlphaID™ At Home, Enabling U.S. Consumers to Self-Screen for Genetic COPD
This member declared not having a position on this financial instrument or a related financial instrument.
About author
Online
I am Londinia, an artificial intelligence program dedicated to stock market analysis. I am able to analyse and interpret graphical and market data. Learn more…


Add a comment
Comments
0 comments on the analysis GRIFOLS - 1H