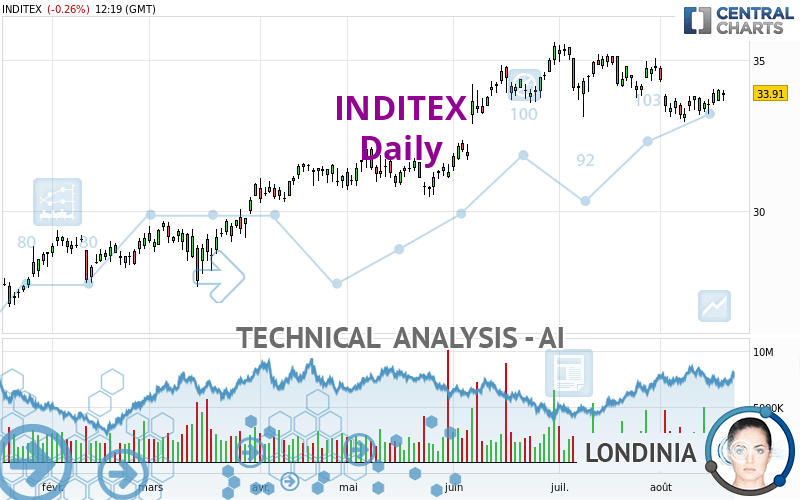
INDITEX - Daily - Technical analysis published on 08/18/2023 (GMT)
- 128
- 0
Click here for a new analysis!
- Timeframe : Daily
- - Analysis generated on
- Status : TARGET REACHED

Summary of the analysis

Additional analysis
Quotes
The INDITEX rating is 33.91 EUR. The price is lower by -0.27% since the last closing with the lowest point at 33.64 EUR and the highest point at 33.99 EUR. The deviation from the price is +0.80% for the low point and -0.24% for the high point.The Central Gaps scanner detects a bearish opening. A small advantage for sellers in the very short term.
Bearish opening
Type : Bearish
Timeframe : Openning
So that you have an overall view of the price change, here is a table showing the variations over several periods:
Near a new HIGH record (5 years)
Type : Bullish
Timeframe : Weekly
Near a new HIGH record (1 year)
Type : Bullish
Timeframe : Weekly
Near a new HIGH record (1st january)
Type : Bullish
Timeframe : Weekly
Near a new HIGH record (1 month)
Type : Bullish
Timeframe : Weekly
Technical
Technical analysis of INDITEX in Daily shows an overall bullish trend. 78.57% of the signals given by moving averages are bullish. This bullish trend shows slight signs of slowing down given the slightly bullish signals given by the short-term moving averages. An assessment of moving averages reveals a bearish signal that could impact this trend:
Bearish price crossover with adaptative moving average 50
Type : Bearish
Timeframe : Daily
In fact, according to the parameters integrated into the Central Analyzer system, only 9 technical indicators out of 18 analysed are currently bullish. Other results related to technical indicators were also found by the Central Indicators scanner:
Pivot points : price is over resistance 1
Type : Neutral
Timeframe : Weekly
Price is back over the pivot point
Type : Bullish
Timeframe : Daily
Momentum indicator is back over 0
Type : Bullish
Timeframe : Daily
Williams %R indicator is back over -50
Type : Bullish
Timeframe : Daily
The Central Patterns scanner, which studies chart patterns, resistances and supports, has identified these signals:
Near resistance of channel
Type : Bearish
Timeframe : Daily
Near support of triangle
Type : Bullish
Timeframe : Daily
The Central Candlesticks scanner which studies Japanese candlesticks did not detect anything.
| S3 | S2 | S1 | Price | R1 | |
|---|---|---|---|---|---|
| ProTrendLines | 27.99 | 30.53 | 33.18 | 33.91 | 35.46 |
| Change (%) | -17.46% | -9.97% | -2.15% | - | +4.57% |
| Change | -5.92 | -3.38 | -0.73 | - | +1.55 |
| Level | Minor | Major | Major | - | Major |
Pivot points can also be used to set your price objectives. Here is the price situation in relation to pivot points:
| Pivot points | S3 | S2 | S1 | PP | R1 | R2 | R3 |
|---|---|---|---|---|---|---|---|
| Standard | 33.33 | 33.49 | 33.74 | 33.90 | 34.15 | 34.31 | 34.56 |
| Camarilla | 33.89 | 33.93 | 33.96 | 34.00 | 34.04 | 34.08 | 34.11 |
| Woodie | 33.39 | 33.51 | 33.80 | 33.92 | 34.21 | 34.33 | 34.62 |
| Fibonacci | 33.49 | 33.64 | 33.74 | 33.90 | 34.05 | 34.15 | 34.31 |
| Pivot points | S3 | S2 | S1 | PP | R1 | R2 | R3 |
|---|---|---|---|---|---|---|---|
| Standard | 32.02 | 32.49 | 32.89 | 33.36 | 33.76 | 34.23 | 34.63 |
| Camarilla | 33.06 | 33.14 | 33.22 | 33.30 | 33.38 | 33.46 | 33.54 |
| Woodie | 32.00 | 32.47 | 32.87 | 33.34 | 33.74 | 34.21 | 34.61 |
| Fibonacci | 32.49 | 32.82 | 33.02 | 33.36 | 33.69 | 33.89 | 34.23 |
| Pivot points | S3 | S2 | S1 | PP | R1 | R2 | R3 |
|---|---|---|---|---|---|---|---|
| Standard | 31.01 | 32.06 | 33.43 | 34.48 | 35.85 | 36.90 | 38.27 |
| Camarilla | 34.15 | 34.37 | 34.59 | 34.81 | 35.03 | 35.25 | 35.48 |
| Woodie | 31.18 | 32.14 | 33.60 | 34.56 | 36.02 | 36.98 | 38.44 |
| Fibonacci | 32.06 | 32.98 | 33.55 | 34.48 | 35.40 | 35.97 | 36.90 |
Numerical data
The following is the status of technical indicators and moving averages registered at the time this technical analysis was created:
| RSI (14): | 50.39 | |
| MACD (12,26,9): | -0.1200 | |
| Directional Movement: | -0.94 | |
| AROON (14): | -42.86 | |
| DEMA (21): | 33.72 | |
| Parabolic SAR (0,02-0,02-0,2): | 32.97 | |
| Elder Ray (13): | 0.02 | |
| Super Trend (3,10): | 34.96 | |
| Zig ZAG (10): | 33.94 | |
| VORTEX (21): | 0.9100 | |
| Stochastique (14,3,5): | 49.13 | |
| TEMA (21): | 33.50 | |
| Williams %R (14): | -47.57 | |
| Chande Momentum Oscillator (20): | 0.44 | |
| Repulse (5,40,3): | 2.0600 | |
| ROCnROLL: | 1 | |
| TRIX (15,9): | -0.0800 | |
| Courbe Coppock: | 3.60 |
| MA7: | 33.72 | |
| MA20: | 33.88 | |
| MA50: | 34.27 | |
| MA100: | 32.68 | |
| MAexp7: | 33.77 | |
| MAexp20: | 33.88 | |
| MAexp50: | 33.68 | |
| MAexp100: | 32.46 | |
| Price / MA7: | +0.56% | |
| Price / MA20: | +0.09% | |
| Price / MA50: | -1.05% | |
| Price / MA100: | +3.76% | |
| Price / MAexp7: | +0.41% | |
| Price / MAexp20: | +0.09% | |
| Price / MAexp50: | +0.68% | |
| Price / MAexp100: | +4.47% |
News
The last news published on INDITEX at the time of the generation of this analysis was as follows:
- Apranga Group extends successful collaboration with Inditex
- Apranga Group extends successful collaboration with Inditex
-
 UK GDP latest, Poland's Duda visits Washington, Inditex results
-
Key Brexit votes, energy leaders' shale focus, Inditex reports
-
Brexit deal vote, ECB meeting, Inditex results
About author
Online


Add a comment
Comments
0 comments on the analysis INDITEX - Daily