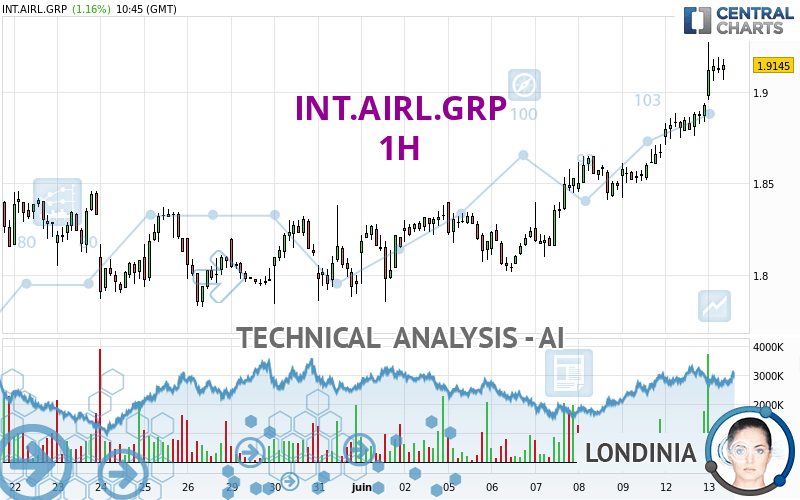
INT.AIRL.GRP - 1H - Technical analysis published on 06/13/2023 (GMT)
- 106
- 0
Click here for a new analysis!
- Timeframe : 1H
- - Analysis generated on
- Status : TARGET REACHED

Summary of the analysis

Additional analysis
Quotes
The INT.AIRL.GRP price is 1.9145 EUR. The price has increased by +1.16% since the last closing and was between 1.8955 EUR and 1.9270 EUR. This implies that the price is at +1.00% from its lowest and at -0.65% from its highest.The Central Gaps scanner detects the formation of a bullish gap marking the strong presence of buyers against sellers at the opening. This formed a quotation gap.
Opening Gap UP
Type : Bullish
Timeframe : Openning
Here is a more detailed summary of the historical variations registered by INT.AIRL.GRP:
Near a new HIGH record (1 year)
Type : Bullish
Timeframe : Weekly
Near a new HIGH record (1st january)
Type : Bullish
Timeframe : Weekly
New HIGH record (1 month)
Type : Bullish
Timeframe : Weekly
Technical
Technical analysis of this 1H chart of INT.AIRL.GRP indicates that the overall trend is strongly bullish. 92.86% of the signals given by moving averages are bullish. This strongly bullish trend is supported by the strong bullish signals given by short-term moving averages. The Central Indicators scanner does not detect any result on moving averages that would impact this trend.
In fact, 15 technical indicators on 18 studied are currently bullish. Caution: the Central Indicators scanner currently detects an excess:
RSI indicator is overbought : over 70
Type : Neutral
Timeframe : 1 hour
CCI indicator is overbought : over 100
Type : Neutral
Timeframe : 1 hour
Williams %R indicator is overbought : over -20
Type : Neutral
Timeframe : 1 hour
Pivot points : price is over resistance 1
Type : Neutral
Timeframe : Weekly
Pivot points : price is over resistance 2
Type : Neutral
Timeframe : 1 hour
An analysis of the price chart with the Central Patterns scanner (detector of chart patterns and resistances and supports) shows several results that can have an impact on the price change:
Near horizontal resistance
Type : Bearish
Timeframe : 1 hour
Resistance of channel is broken
Type : Bullish
Timeframe : 1 hour
The presence of a bullish Japanese candlestick pattern detected by Central Candlesticks that could cause a very short term rebound was also detected:
Bullish engulfing lines
Type : Bullish
Timeframe : 1 hour
| S3 | S2 | S1 | Price | R1 | R2 | R3 | |
|---|---|---|---|---|---|---|---|
| ProTrendLines | 1.7830 | 1.8460 | 1.8655 | 1.9145 | 1.9388 | 2.5300 | 3.6508 |
| Change (%) | -6.87% | -3.58% | -2.56% | - | +1.27% | +32.15% | +90.69% |
| Change | -0.1315 | -0.0685 | -0.0490 | - | +0.0243 | +0.6155 | +1.7363 |
| Level | Intermediate | Major | Major | - | Major | Intermediate | Minor |
Attention could also be paid to pivot points to set price objectives:
| Pivot points | S3 | S2 | S1 | PP | R1 | R2 | R3 |
|---|---|---|---|---|---|---|---|
| Standard | 1.8553 | 1.8632 | 1.8778 | 1.8857 | 1.9003 | 1.9082 | 1.9228 |
| Camarilla | 1.8863 | 1.8884 | 1.8904 | 1.8925 | 1.8946 | 1.8966 | 1.8987 |
| Woodie | 1.8588 | 1.8649 | 1.8813 | 1.8874 | 1.9038 | 1.9099 | 1.9263 |
| Fibonacci | 1.8632 | 1.8718 | 1.8771 | 1.8857 | 1.8943 | 1.8996 | 1.9082 |
| Pivot points | S3 | S2 | S1 | PP | R1 | R2 | R3 |
|---|---|---|---|---|---|---|---|
| Standard | 1.7515 | 1.7765 | 1.8215 | 1.8465 | 1.8915 | 1.9165 | 1.9615 |
| Camarilla | 1.8473 | 1.8537 | 1.8601 | 1.8665 | 1.8729 | 1.8793 | 1.8858 |
| Woodie | 1.7615 | 1.7815 | 1.8315 | 1.8515 | 1.9015 | 1.9215 | 1.9715 |
| Fibonacci | 1.7765 | 1.8032 | 1.8198 | 1.8465 | 1.8732 | 1.8898 | 1.9165 |
| Pivot points | S3 | S2 | S1 | PP | R1 | R2 | R3 |
|---|---|---|---|---|---|---|---|
| Standard | 1.4472 | 1.5448 | 1.6707 | 1.7683 | 1.8942 | 1.9918 | 2.1177 |
| Camarilla | 1.7350 | 1.7555 | 1.7760 | 1.7965 | 1.8170 | 1.8375 | 1.8580 |
| Woodie | 1.4613 | 1.5519 | 1.6848 | 1.7754 | 1.9083 | 1.9989 | 2.1318 |
| Fibonacci | 1.5448 | 1.6302 | 1.6830 | 1.7683 | 1.8537 | 1.9065 | 1.9918 |
Numerical data
The following are the details of the technical indicators and moving averages that were collected to generate this technical analysis:
| RSI (14): | 77.98 | |
| MACD (12,26,9): | 0.0165 | |
| Directional Movement: | 27.9400 | |
| AROON (14): | 78.5714 | |
| DEMA (21): | 1.9061 | |
| Parabolic SAR (0,02-0,02-0,2): | 1.8992 | |
| Elder Ray (13): | 0.0177 | |
| Super Trend (3,10): | 1.8795 | |
| Zig ZAG (10): | 1.9150 | |
| VORTEX (21): | 1.2563 | |
| Stochastique (14,3,5): | 79.67 | |
| TEMA (21): | 1.9127 | |
| Williams %R (14): | -18.90 | |
| Chande Momentum Oscillator (20): | 0.0355 | |
| Repulse (5,40,3): | 0.5999 | |
| ROCnROLL: | 1 | |
| TRIX (15,9): | 0.1055 | |
| Courbe Coppock: | 4.31 |
| MA7: | 1.8597 | |
| MA20: | 1.8326 | |
| MA50: | 1.7569 | |
| MA100: | 1.7627 | |
| MAexp7: | 1.9043 | |
| MAexp20: | 1.8855 | |
| MAexp50: | 1.8622 | |
| MAexp100: | 1.8430 | |
| Price / MA7: | +2.95% | |
| Price / MA20: | +4.47% | |
| Price / MA50: | +8.97% | |
| Price / MA100: | +8.61% | |
| Price / MAexp7: | +0.54% | |
| Price / MAexp20: | +1.54% | |
| Price / MAexp50: | +2.81% | |
| Price / MAexp100: | +3.88% |
News
The latest news and videos published on INT.AIRL.GRP at the time of the analysis were as follows:
- BigCommerce Powers New IAG Loyalty Online Wine Store in Partnership with British Airways
-
 Why Are IAG Shares Cheap?
-
US Non-Farm payrolls, Bank of England, IAG, Next, Boohoo and IHG results - 3 May 2021
-
UK unemployment, US and German GDP, HSBC, Lloyds, IAG – 22 February 2021
-
IAG chief Willie Walsh has hinted at legal action over UK quarantine
About author
Online


Add a comment
Comments
0 comments on the analysis INT.AIRL.GRP - 1H