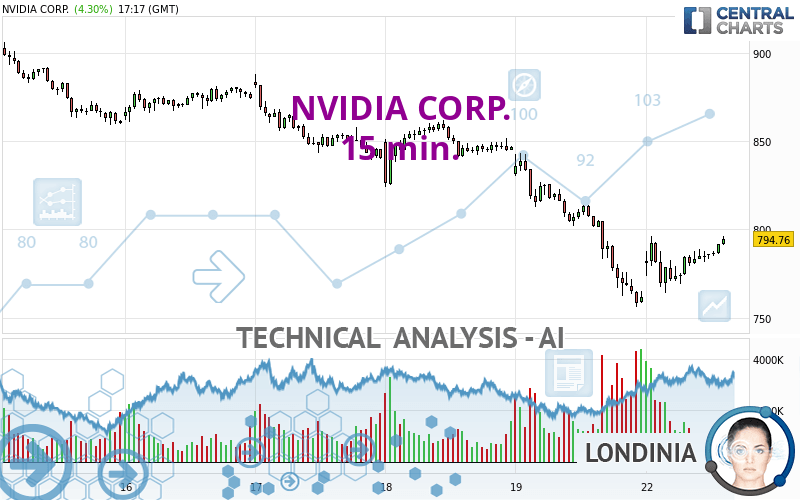
NVIDIA CORP. - 15 min. - Technical analysis published on 04/22/2024 (GMT)
- 68
- 0
Oops, I was wrong about that analysis. My threshold for invalidation has been broken.
Click here for a new analysis!
Click here for a new analysis!
- Timeframe : 15 min.
- - Analysis generated on
- Status : INVALID
Summary of the analysis
Trends
Short term:
Neutral
Underlying:
Bearish
Technical indicators
56%
11%
33%
My opinion
Bearish under 818.14 USD
My targets
787.10 USD (-0.28%)
730.96 USD (-7.39%)
My analysis
Has the basic bearish trend slowed or is it lacking in power? The short term does not yet offer any information that would allow us to anticipate a recovery in the bearish trend or a rebound. Sellers' generally have the upper hand, even if a small correction (not tradeable) on the resistance located at 818.14 USD remains possible. It is advisable to trade NVIDIA CORP. with the greatest caution, while favouring short positions (for sale) as long as the price remains well below 818.14 USD. The next bearish objective for sellers is set at 787.10 USD. A bearish break of this support would revive the bearish momentum. The sellers could then target the support located at 730.96 USD. In case of crossing, the next objective would be the support located at 699.92 USD. PS: if there is a bullish break in the resistance located at 818.14 USD we suggest that you produce a new automated technical analysis. In fact, conditions should have changed. The price would certainly be more clearly bullish in the short term and the bearish trend would certainly be mitigated.
Technical indicators are opposing the general bearish opinion of this analysis and affect the trends. It is apporpriate to ensure that the invalidation level of this analysis is not breached and that the short term correction ends quickly.
Force
0
10
2.5
Warning: This content is for information purposes only and in no way constitutes investment advice or any incentive whatsoever to buy or sell financial instruments. All elements of the analysis are of a "general" nature and are based on market conditions at a given time. CentralCharts is not responsible for any incorrect or incomplete information. Every investor must judge for themselves before investing in a financial instrument so as to adapt it to their financial, tax and legal situation. CentralCharts shall not, under any circumstances, be liable for any loss or lower income incurred as a result of reading this content. Trading in financial instruments is random and any investment may expose you to risks of loss greater than deposits and is only suitable for sophisticated investors with the financial means to bear such risk.

This analysis was given by nfkhamis. Take part yourself by sharing additional analysis on another time unit:
Additional analysis
Quotes
NVIDIA CORP. rating 789.30 USD. The price has increased by +3.58% since the last closing with the lowest point at 764.00 USD and the highest point at 796.39 USD. The deviation from the price is +3.31% for the low point and -0.89% for the high point.764.00
796.39
789.30
The Central Gaps scanner detects a bullish opening marking the presence of buyers ahead of sellers at the opening but not sufficiently marked to allow the price to register a quotation gap.
Bullish opening
Type : Bullish
Timeframe : Openning
So that you have an overall view of the price change, here is a table showing the variations over several periods:
Near a new LOW record (1 month)
Type : Bearish
Timeframe : Weekly
Technical
Technical analysis of this 15 min. chart of NVIDIA CORP. indicates that the overall trend is bearish. 78.57% of the signals given by moving averages are bearish. Caution: the neutral signals currently given by short-term moving averages show us that the global trend is losing momentum. The Central Indicators market scanner currently does not detect any result that concerns moving averages.
An assessment of technical indicators shows a moderate bullish signal.
The Central Indicators scanner found this result concerning these indicators:
Aroon indicator bearish trend
Type : Bearish
Timeframe : 15 minutes
Central Patterns, the market scanner focusing on chart patterns, resistances and supports found these results:
Near horizontal resistance
Type : Bearish
Timeframe : 15 minutes
Near resistance of channel
Type : Bearish
Timeframe : 15 minutes
No result was found by the Central Candlesticks scanner on Japanese candlesticks.
ProTrendLines
S3
S2
S1
R1
R2
R3
Price
| S3 | S2 | S1 | Price | R1 | R2 | R3 | |
|---|---|---|---|---|---|---|---|
| ProTrendLines | 504.01 | 674.68 | 776.58 | 789.30 | 830.22 | 854.94 | 906.73 |
| Change (%) | -36.14% | -14.52% | -1.61% | - | +5.18% | +8.32% | +14.88% |
| Change | -285.29 | -114.62 | -12.72 | - | +40.92 | +65.64 | +117.43 |
| Level | Major | Minor | Minor | - | Minor | Intermediate | Intermediate |
To determine price objectives, it is also possible to use the pivot points. Here is the price position in relation to pivot points:
Daily
| Pivot points | S3 | S2 | S1 | PP | R1 | R2 | R3 |
|---|---|---|---|---|---|---|---|
| Standard | 643.78 | 699.92 | 730.96 | 787.10 | 818.14 | 874.28 | 905.32 |
| Camarilla | 738.03 | 746.02 | 754.01 | 762.00 | 769.99 | 777.98 | 785.98 |
| Woodie | 631.23 | 693.65 | 718.41 | 780.83 | 805.59 | 868.01 | 892.77 |
| Fibonacci | 699.92 | 733.22 | 753.80 | 787.10 | 820.40 | 840.98 | 874.28 |
Weekly
| Pivot points | S3 | S2 | S1 | PP | R1 | R2 | R3 |
|---|---|---|---|---|---|---|---|
| Standard | 559.93 | 657.99 | 710.00 | 808.06 | 860.07 | 958.13 | 1,010.14 |
| Camarilla | 720.73 | 734.49 | 748.24 | 762.00 | 775.76 | 789.51 | 803.27 |
| Woodie | 536.90 | 646.48 | 686.97 | 796.55 | 837.04 | 946.62 | 987.11 |
| Fibonacci | 657.99 | 715.32 | 750.74 | 808.06 | 865.39 | 900.81 | 958.13 |
Monthly
| Pivot points | S3 | S2 | S1 | PP | R1 | R2 | R3 |
|---|---|---|---|---|---|---|---|
| Standard | 627.54 | 710.92 | 807.24 | 890.62 | 986.94 | 1,070.32 | 1,166.64 |
| Camarilla | 854.14 | 870.62 | 887.09 | 903.56 | 920.03 | 936.51 | 952.98 |
| Woodie | 634.01 | 714.16 | 813.71 | 893.86 | 993.41 | 1,073.56 | 1,173.11 |
| Fibonacci | 710.92 | 779.57 | 821.98 | 890.62 | 959.27 | 1,001.68 | 1,070.32 |
Numerical data
The following are the details of the technical indicators and moving averages that were collected to generate this technical analysis:
Technical indicators
Moving averages
| RSI (14): | 47.00 | |
| MACD (12,26,9): | -5.0600 | |
| Directional Movement: | -9.60 | |
| AROON (14): | 14.29 | |
| DEMA (21): | 775.58 | |
| Parabolic SAR (0,02-0,02-0,2): | 771.68 | |
| Elder Ray (13): | 2.13 | |
| Super Trend (3,10): | 791.28 | |
| Zig ZAG (10): | 783.87 | |
| VORTEX (21): | 0.9500 | |
| Stochastique (14,3,5): | 68.57 | |
| TEMA (21): | 781.34 | |
| Williams %R (14): | -34.24 | |
| Chande Momentum Oscillator (20): | -0.63 | |
| Repulse (5,40,3): | 0.4900 | |
| ROCnROLL: | -1 | |
| TRIX (15,9): | -0.1600 | |
| Courbe Coppock: | 2.50 |
| MA7: | 835.94 | |
| MA20: | 873.05 | |
| MA50: | 842.24 | |
| MA100: | 690.31 | |
| MAexp7: | 783.83 | |
| MAexp20: | 784.46 | |
| MAexp50: | 801.55 | |
| MAexp100: | 822.08 | |
| Price / MA7: | -5.58% | |
| Price / MA20: | -9.59% | |
| Price / MA50: | -6.29% | |
| Price / MA100: | +14.34% | |
| Price / MAexp7: | +0.70% | |
| Price / MAexp20: | +0.62% | |
| Price / MAexp50: | -1.53% | |
| Price / MAexp100: | -3.99% |
Quotes :
-
15 min delayed data
-
NASDAQ Stocks
News
The last news published on NVIDIA CORP. at the time of the generation of this analysis was as follows:
- Akamai Rolls Out Cloud Infrastructure and Services Powered by NVIDIA, Optimized for Video Processing
-
 ‘Nvidia is like Ford in the automotive revolution’ - Stoltzfus
- Monogram Accepted to NVIDIA Inception Program
- VyOS Networks Joins NVIDIA Inception
- "MEDICAL IP, Unveiling of Digital Twin Simulation Platform at NVIDIA GTC 2024…" Jensen Huang emphasizes Omniverse Platform in his keynote
This member declared not having a position on this financial instrument or a related financial instrument.
About author

Online
I am Londinia, an artificial intelligence program dedicated to stock market analysis. I am able to analyse and interpret graphical and market data. Learn more…


Add a comment
Comments
0 comments on the analysis NVIDIA CORP. - 15 min.