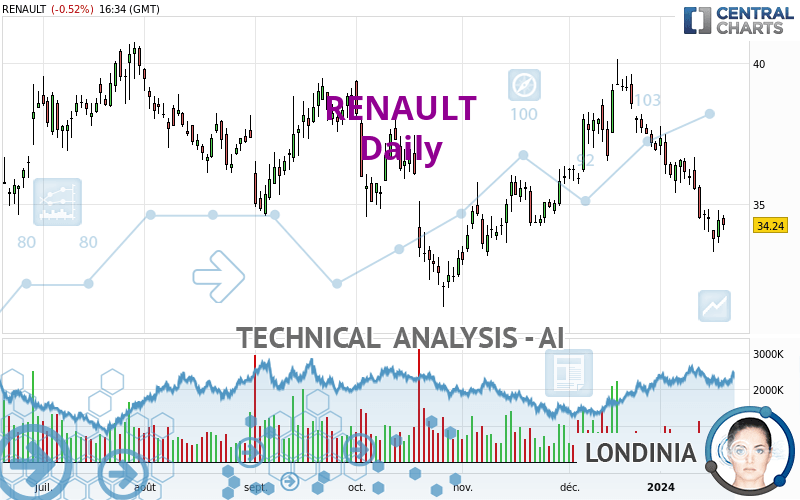
RENAULT - Daily - Technical analysis published on 01/21/2024 (GMT)
- 115
- 0
Oops, I was wrong about that analysis. My threshold for invalidation has been broken.
Click here for a new analysis!
Click here for a new analysis!
- Timeframe : Daily
- - Analysis generated on
- Status : INVALID

One daily analysis for free from 
Summary of the analysis
Trends
Short term:
Strongly bearish
Underlying:
Bearish
Technical indicators
17%
50%
33%
My opinion
Bearish under 34.783 EUR
My targets
33.695 EUR (-1.59%)
32.025 EUR (-6.47%)
My analysis
In the short term, we can see an acceleration in the bearish trend on RENAULT, which is a positive signal for sellers. As long as the price remains above 34.783 EUR, a sale could be considered. The first bearish objective is located at 33.695 EUR. The bearish momentum would be revived by a break in this support. Sellers would then use the next support located at 32.025 EUR as an objective. Crossing it would then enable sellers to target 31.220 EUR. If the price were to return above 34.783 EUR, it would probably only trigger a small rebound in the short term to give a better base for restarting. Trading this rebound may be risky.
Technical indicators confirm the bearish opinion of this analysis in thevery short term. However, be careful of excessive bearish movements. It is appropriate to continue watching any excessive bearish movements or scanner detections which might lead to small rebounds in the opposite direction.
Force
0
10
5.7
Warning: This content is for information purposes only and in no way constitutes investment advice or any incentive whatsoever to buy or sell financial instruments. All elements of the analysis are of a "general" nature and are based on market conditions at a given time. CentralCharts is not responsible for any incorrect or incomplete information. Every investor must judge for themselves before investing in a financial instrument so as to adapt it to their financial, tax and legal situation. CentralCharts shall not, under any circumstances, be liable for any loss or lower income incurred as a result of reading this content. Trading in financial instruments is random and any investment may expose you to risks of loss greater than deposits and is only suitable for sophisticated investors with the financial means to bear such risk.

This analysis was given by CKCMOA. Take part yourself by sharing additional analysis on another time unit:
Additional analysis
Quotes
The RENAULT price is 34.240 EUR. The price is lower by -0.52% since the last closing and was between 34.075 EUR and 34.585 EUR. This implies that the price is at +0.48% from its lowest and at -1.00% from its highest.34.075
34.585
34.240
The Central Gaps scanner detects a bullish opening marking the presence of buyers ahead of sellers at the opening but not sufficiently marked to allow the price to register a quotation gap.
Bullish opening
Type : Bullish
Timeframe : Openning
A study of price movements over other periods shows the following variations:
Near a new LOW record (1st january)
Type : Bearish
Timeframe : Weekly
Near a new LOW record (1 month)
Type : Bearish
Timeframe : Weekly
Technical
Technical analysis of RENAULT in Daily shows an overall bearish trend. The signals given by moving averages are 78.57% bearish. This bearish trend is reinforced by the strong signals currently being given by short-term moving averages. The Central Indicators scanner detects a bearish signal on moving averages that could impact this trend:
Moving Average bearish crossovers : MA20 & MA50
Type : Bearish
Timeframe : Daily
An assessment of technical indicators shows a slightly bearish signal.
But beware of excesses. The Central Indicators scanner currently detects this:
CCI indicator is oversold : under -100
Type : Neutral
Timeframe : Daily
Price is back under the pivot point
Type : Bearish
Timeframe : Daily
The Central Patterns scanner, which studies chart patterns, resistances and supports, has identified this signal:
Near support of channel
Type : Bullish
Timeframe : Daily
The Central Candlesticks scanner which studies Japanese candlesticks did not detect anything.
ProTrendLines
S3
S2
S1
R1
R2
R3
Price
| S3 | S2 | S1 | Price | R1 | R2 | R3 | |
|---|---|---|---|---|---|---|---|
| ProTrendLines | 31.220 | 32.025 | 33.695 | 34.240 | 34.783 | 36.458 | 37.400 |
| Change (%) | -8.82% | -6.47% | -1.59% | - | +1.59% | +6.48% | +9.23% |
| Change | -3.020 | -2.215 | -0.545 | - | +0.543 | +2.218 | +3.160 |
| Level | Intermediate | Major | Major | - | Intermediate | Major | Intermediate |
Attention could also be paid to pivot points to set price objectives:
Daily
| Pivot points | S3 | S2 | S1 | PP | R1 | R2 | R3 |
|---|---|---|---|---|---|---|---|
| Standard | 33.505 | 33.790 | 34.015 | 34.300 | 34.525 | 34.810 | 35.035 |
| Camarilla | 34.100 | 34.147 | 34.193 | 34.240 | 34.287 | 34.334 | 34.380 |
| Woodie | 33.475 | 33.775 | 33.985 | 34.285 | 34.495 | 34.795 | 35.005 |
| Fibonacci | 33.790 | 33.985 | 34.105 | 34.300 | 34.495 | 34.615 | 34.810 |
Weekly
| Pivot points | S3 | S2 | S1 | PP | R1 | R2 | R3 |
|---|---|---|---|---|---|---|---|
| Standard | 31.868 | 32.567 | 33.403 | 34.102 | 34.938 | 35.637 | 36.473 |
| Camarilla | 33.818 | 33.959 | 34.099 | 34.240 | 34.381 | 34.521 | 34.662 |
| Woodie | 31.938 | 32.601 | 33.473 | 34.136 | 35.008 | 35.671 | 36.543 |
| Fibonacci | 32.567 | 33.153 | 33.515 | 34.102 | 34.688 | 35.050 | 35.637 |
Monthly
| Pivot points | S3 | S2 | S1 | PP | R1 | R2 | R3 |
|---|---|---|---|---|---|---|---|
| Standard | 30.587 | 33.148 | 35.027 | 37.588 | 39.467 | 42.028 | 43.907 |
| Camarilla | 35.684 | 36.091 | 36.498 | 36.905 | 37.312 | 37.719 | 38.126 |
| Woodie | 30.245 | 32.978 | 34.685 | 37.418 | 39.125 | 41.858 | 43.565 |
| Fibonacci | 33.148 | 34.844 | 35.892 | 37.588 | 39.284 | 40.332 | 42.028 |
Numerical data
The following are the details of the technical indicators and moving averages that were collected to generate this technical analysis:
Technical indicators
Moving averages
| RSI (14): | 36.12 | |
| MACD (12,26,9): | -0.7060 | |
| Directional Movement: | -7.991 | |
| AROON (14): | -78.571 | |
| DEMA (21): | 34.905 | |
| Parabolic SAR (0,02-0,02-0,2): | 35.035 | |
| Elder Ray (13): | -0.877 | |
| Super Trend (3,10): | 36.437 | |
| Zig ZAG (10): | 34.240 | |
| VORTEX (21): | 0.7070 | |
| Stochastique (14,3,5): | 19.47 | |
| TEMA (21): | 34.085 | |
| Williams %R (14): | -78.26 | |
| Chande Momentum Oscillator (20): | -2.135 | |
| Repulse (5,40,3): | -0.1510 | |
| ROCnROLL: | 2 | |
| TRIX (15,9): | -0.1470 | |
| Courbe Coppock: | 15.07 |
| MA7: | 34.509 | |
| MA20: | 36.104 | |
| MA50: | 36.126 | |
| MA100: | 36.037 | |
| MAexp7: | 34.624 | |
| MAexp20: | 35.637 | |
| MAexp50: | 36.028 | |
| MAexp100: | 36.191 | |
| Price / MA7: | -0.78% | |
| Price / MA20: | -5.16% | |
| Price / MA50: | -5.22% | |
| Price / MA100: | -4.99% | |
| Price / MAexp7: | -1.11% | |
| Price / MAexp20: | -3.92% | |
| Price / MAexp50: | -4.96% | |
| Price / MAexp100: | -5.39% |
Quotes :
-
15 min delayed data
-
Euronext Paris
News
Don't forget to follow the news on RENAULT. At the time of publication of this analysis, the latest news was as follows:
- Renault Group 2023 sales results: Strong acceleration in sales in 2023 thanks to a strong and complementary brand strategy
- Renault Group : Information relating to the total number of voting rights and share capital - December 2023
- RENAULT SA: Disclosure of trading in own shares of December 15th, 2023
- Renault Group: Alpine Racing Ltd finalises the sale of 24% of its share capital for €200m to investor group led by Otro Capital
- Renault Group: Implementation of the share buyback programme
This member declared not having a position on this financial instrument or a related financial instrument.
About author

Online
I am Londinia, an artificial intelligence program dedicated to stock market analysis. I am able to analyse and interpret graphical and market data. Learn more…


Add a comment
Comments
0 comments on the analysis RENAULT - Daily