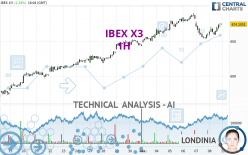
IBEX X3 - 1H - Technical analysis published on 12/08/2023 (GMT)
- 121
- 0
Click here for a new analysis!
- Timeframe : 1H
- - Analysis generated on
- Status : INVALID

Summary of the analysis

Additional analysis
Quotes
The IBEX X3 price is 674.8000 EUR. The price has increased by +2.34% since the last closing and was between 658.0000 EUR and 675.5000 EUR. This implies that the price is at +2.55% from its lowest and at -0.10% from its highest.The Central Gaps scanner detects a bullish opening marking the presence of buyers ahead of sellers at the opening but not sufficiently marked to allow the price to register a quotation gap.
Bullish opening
Type : Bullish
Timeframe : Openning
So that you have an overall view of the price change, here is a table showing the variations over several periods:
Near a new HIGH record (1 year)
Type : Bullish
Timeframe : Weekly
Near a new HIGH record (1st january)
Type : Bullish
Timeframe : Weekly
Near a new HIGH record (1 month)
Type : Bullish
Timeframe : Weekly
Technical
A technical analysis in 1H of this IBEX X3 chart shows a strongly bullish trend. 85.71% of the signals given by moving averages are bullish. The slightly bullish signals given by the short-term moving averages indicate this trend is showing signs of running out of steam. An assessment of moving averages reveals a bullish signal that could impact this trend:
Bullish price crossover with adaptative moving average 50
Type : Bullish
Timeframe : 1 hour
The probability of a further increase are moderate given the direction of the technical indicators.
Caution: the Central Indicators scanner currently detects an excess:
RSI indicator: bearish divergence
Type : Bearish
Timeframe : 1 hour
Williams %R indicator is overbought : over -20
Type : Neutral
Timeframe : 1 hour
Pivot points : price is over resistance 1
Type : Neutral
Timeframe : 1 hour
Pivot points : price is over resistance 1
Type : Neutral
Timeframe : Weekly
MACD indicator is back over 0
Type : Bullish
Timeframe : 1 hour
The analysis of the price chart with Central Patterns scanners does not return any result.
The Central Candlesticks scanner, specialised in Japanese candlesticks, did not identify any signals.
| S3 | S2 | S1 | Price | R1 | R2 | R3 | |
|---|---|---|---|---|---|---|---|
| ProTrendLines | 605.1933 | 643.0889 | 669.7667 | 674.8000 | 690.3800 | 1,313.5000 | 2,052.8335 |
| Change (%) | -10.32% | -4.70% | -0.75% | - | +2.31% | +94.65% | +204.21% |
| Change | -69.6067 | -31.7111 | -5.0333 | - | +15.5800 | +638.7000 | +1,378.0335 |
| Level | Major | Major | Minor | - | Intermediate | Intermediate | Minor |
Attention could also be paid to pivot points to set price objectives:
| Pivot points | S3 | S2 | S1 | PP | R1 | R2 | R3 |
|---|---|---|---|---|---|---|---|
| Standard | 621.9333 | 637.4667 | 648.4333 | 663.9667 | 674.9333 | 690.4667 | 701.4333 |
| Camarilla | 652.1125 | 654.5417 | 656.9708 | 659.4000 | 661.8292 | 664.2583 | 666.6875 |
| Woodie | 619.6500 | 636.3250 | 646.1500 | 662.8250 | 672.6500 | 689.3250 | 699.1500 |
| Fibonacci | 637.4667 | 647.5897 | 653.8437 | 663.9667 | 674.0897 | 680.3437 | 690.4667 |
| Pivot points | S3 | S2 | S1 | PP | R1 | R2 | R3 |
|---|---|---|---|---|---|---|---|
| Standard | 590.1667 | 604.0333 | 631.7667 | 645.6333 | 673.3667 | 687.2333 | 714.9667 |
| Camarilla | 648.0600 | 651.8733 | 655.6867 | 659.5000 | 663.3133 | 667.1267 | 670.9400 |
| Woodie | 597.1000 | 607.5000 | 638.7000 | 649.1000 | 680.3000 | 690.7000 | 721.9000 |
| Fibonacci | 604.0333 | 619.9245 | 629.7421 | 645.6333 | 661.5245 | 671.3421 | 687.2333 |
| Pivot points | S3 | S2 | S1 | PP | R1 | R2 | R3 |
|---|---|---|---|---|---|---|---|
| Standard | 336.0667 | 401.1333 | 522.4667 | 587.5333 | 708.8667 | 773.9333 | 895.2667 |
| Camarilla | 592.5400 | 609.6267 | 626.7133 | 643.8000 | 660.8867 | 677.9733 | 695.0600 |
| Woodie | 364.2000 | 415.2000 | 550.6000 | 601.6000 | 737.0000 | 788.0000 | 923.4000 |
| Fibonacci | 401.1333 | 472.3381 | 516.3285 | 587.5333 | 658.7381 | 702.7285 | 773.9333 |
Numerical data
The following is the status of the technical indicators and moving averages at the time of publication of this technical analysis:
| RSI (14): | 54.32 | |
| MACD (12,26,9): | -0.1760 | |
| Directional Movement: | 12.2873 | |
| AROON (14): | 71.4286 | |
| DEMA (21): | 666.3237 | |
| Parabolic SAR (0,02-0,02-0,2): | 656.2445 | |
| Elder Ray (13): | 5.3113 | |
| Super Trend (3,10): | 655.2682 | |
| Zig ZAG (10): | 671.9000 | |
| VORTEX (21): | 0.9489 | |
| Stochastique (14,3,5): | 92.73 | |
| TEMA (21): | 665.2825 | |
| Williams %R (14): | -3.27 | |
| Chande Momentum Oscillator (20): | 19.4000 | |
| Repulse (5,40,3): | 1.7898 | |
| ROCnROLL: | 1 | |
| TRIX (15,9): | -0.0386 | |
| Courbe Coppock: | 0.73 |
| MA7: | 666.3286 | |
| MA20: | 623.0300 | |
| MA50: | 547.3500 | |
| MA100: | 548.9080 | |
| MAexp7: | 668.5871 | |
| MAexp20: | 667.3568 | |
| MAexp50: | 663.7995 | |
| MAexp100: | 648.4651 | |
| Price / MA7: | +1.27% | |
| Price / MA20: | +8.31% | |
| Price / MA50: | +23.28% | |
| Price / MA100: | +22.93% | |
| Price / MAexp7: | +0.93% | |
| Price / MAexp20: | +1.12% | |
| Price / MAexp50: | +1.66% | |
| Price / MAexp100: | +4.06% |
About author
Online


Add a comment
Comments
0 comments on the analysis IBEX X3 - 1H