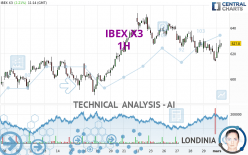
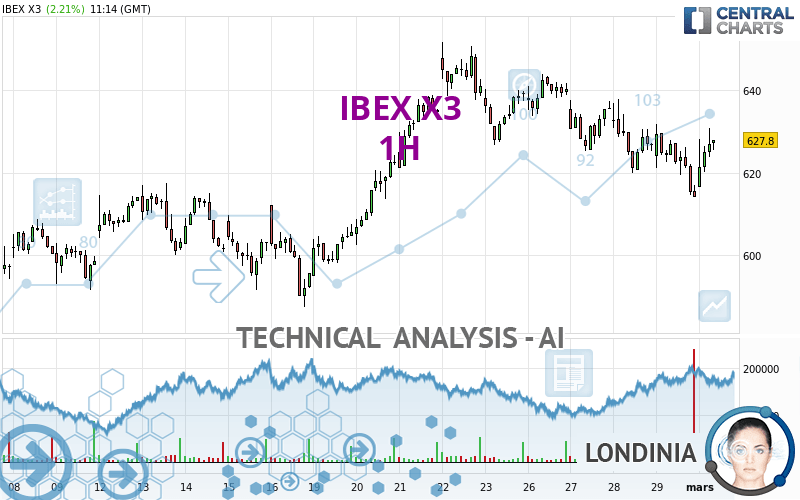
IBEX X3 - 1H - Technical analysis published on 03/01/2024 (GMT)
- 102
- 0
- Timeframe : 1H
- - Analysis generated on
- Status : NEUTRAL
Summary of the analysis

Additional analysis
Quotes
The IBEX X3 price is 626.5000 EUR. The price registered an increase of +2.00% on the session and was traded between 615.4000 EUR and 631.0000 EUR over the period. The price is currently at +1.80% from its lowest and -0.71% from its highest.The Central Gaps scanner detects a bullish opening. A small advantage for buyers in the very short term.
Bullish opening
Type : Bullish
Timeframe : Openning
A study of price movements over other periods shows the following variations:
Near a new LOW record (1st january)
Type : Bearish
Timeframe : Weekly
Near a new LOW record (1 month)
Type : Bearish
Timeframe : Weekly
Technical
A technical analysis in 1H of this IBEX X3 chart shows a slightly bullish trend. 60.71% of the signals given by moving averages are bullish. As the signals currently given by short-term moving averages are rather neutral, the slightly bullish trend could return to neutral. The Central Indicators scanner detects bullish signals on moving averages that could impact this trend:
Bullish trend reversal : adaptative moving average 20
Type : Bullish
Timeframe : 1 hour
Bullish trend reversal : adaptative moving average 100
Type : Bullish
Timeframe : 1 hour
In fact, 10 technical indicators on 18 studied are currently positioned bullish. Central Indicators, the scanner specialised in technical indicators, has identified these signals:
Pivot points : price is over resistance 1
Type : Neutral
Timeframe : 1 hour
RSI indicator is back over 50
Type : Bullish
Timeframe : 1 hour
MACD crosses UP its Moving Average
Type : Bullish
Timeframe : 1 hour
Ichimoku : price is under the cloud
Type : Bearish
Timeframe : 1 hour
Price is back under the pivot point
Type : Bearish
Timeframe : Weekly
Momentum indicator is back under 0
Type : Bearish
Timeframe : 1 hour
The analysis of the price chart with Central Patterns scanners does not return any result.
The Central Candlesticks scanner, specialised in Japanese candlesticks, did not identify any signals.
| S3 | S2 | S1 | Price | R1 | R2 | R3 | |
|---|---|---|---|---|---|---|---|
| ProTrendLines | 604.4231 | 612.2000 | 617.2857 | 626.5000 | 634.0000 | 643.8334 | 651.7000 |
| Change (%) | -3.52% | -2.28% | -1.47% | - | +1.20% | +2.77% | +4.02% |
| Change | -22.0769 | -14.3000 | -9.2143 | - | +7.5000 | +17.3334 | +25.2000 |
| Level | Major | Minor | Major | - | Major | Minor | Minor |
To determine price objectives, it is also possible to use the pivot points. Here is the price position in relation to pivot points:
| Pivot points | S3 | S2 | S1 | PP | R1 | R2 | R3 |
|---|---|---|---|---|---|---|---|
| Standard | 590.5667 | 602.3333 | 608.2667 | 620.0333 | 625.9667 | 637.7333 | 643.6667 |
| Camarilla | 609.3325 | 610.9550 | 612.5775 | 614.2000 | 615.8225 | 617.4450 | 619.0675 |
| Woodie | 587.6500 | 600.8750 | 605.3500 | 618.5750 | 623.0500 | 636.2750 | 640.7500 |
| Fibonacci | 602.3333 | 609.0947 | 613.2719 | 620.0333 | 626.7947 | 630.9719 | 637.7333 |
| Pivot points | S3 | S2 | S1 | PP | R1 | R2 | R3 |
|---|---|---|---|---|---|---|---|
| Standard | 546.4333 | 570.0667 | 604.7333 | 628.3667 | 663.0333 | 686.6667 | 721.3333 |
| Camarilla | 623.3675 | 628.7117 | 634.0558 | 639.4000 | 644.7442 | 650.0883 | 655.4325 |
| Woodie | 551.9500 | 572.8250 | 610.2500 | 631.1250 | 668.5500 | 689.4250 | 726.8500 |
| Fibonacci | 570.0667 | 592.3373 | 606.0961 | 628.3667 | 650.6373 | 664.3961 | 686.6667 |
| Pivot points | S3 | S2 | S1 | PP | R1 | R2 | R3 |
|---|---|---|---|---|---|---|---|
| Standard | 519.1333 | 553.2667 | 583.7333 | 617.8667 | 648.3333 | 682.4667 | 712.9333 |
| Camarilla | 596.4350 | 602.3567 | 608.2783 | 614.2000 | 620.1217 | 626.0433 | 631.9650 |
| Woodie | 517.3000 | 552.3500 | 581.9000 | 616.9500 | 646.5000 | 681.5500 | 711.1000 |
| Fibonacci | 553.2667 | 577.9439 | 593.1895 | 617.8667 | 642.5439 | 657.7895 | 682.4667 |
Numerical data
The following is the status of technical indicators and moving averages registered at the time this technical analysis was created:
| RSI (14): | 51.25 | |
| MACD (12,26,9): | -2.3935 | |
| Directional Movement: | 8.0183 | |
| AROON (14): | -57.1428 | |
| DEMA (21): | 622.1187 | |
| Parabolic SAR (0,02-0,02-0,2): | 615.1349 | |
| Elder Ray (13): | 1.6942 | |
| Super Trend (3,10): | 631.0123 | |
| Zig ZAG (10): | 627.2000 | |
| VORTEX (21): | 0.9417 | |
| Stochastique (14,3,5): | 68.94 | |
| TEMA (21): | 621.5128 | |
| Williams %R (14): | -28.41 | |
| Chande Momentum Oscillator (20): | -2.4000 | |
| Repulse (5,40,3): | 0.1723 | |
| ROCnROLL: | -1 | |
| TRIX (15,9): | -0.0667 | |
| Courbe Coppock: | 1.76 |
| MA7: | 632.1143 | |
| MA20: | 616.3850 | |
| MA50: | 625.0240 | |
| MA100: | 596.4990 | |
| MAexp7: | 624.0163 | |
| MAexp20: | 624.8189 | |
| MAexp50: | 627.2862 | |
| MAexp100: | 624.5444 | |
| Price / MA7: | -0.89% | |
| Price / MA20: | +1.64% | |
| Price / MA50: | +0.24% | |
| Price / MA100: | +5.03% | |
| Price / MAexp7: | +0.40% | |
| Price / MAexp20: | +0.27% | |
| Price / MAexp50: | -0.13% | |
| Price / MAexp100: | +0.31% |
About author
Online


Add a comment
Comments
0 comments on the analysis IBEX X3 - 1H