NEO - NEO/USD - 1H - Technical analysis published on 02/28/2022 (GMT)
- 207
- 0
Oops, I was wrong about that analysis. My threshold for invalidation has been broken.
Click here for a new analysis!
Click here for a new analysis!
- Timeframe : 1H
- - Analysis generated on
- Status : INVALID
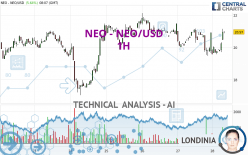

NEO - NEO/USD Chart
Summary of the analysis
Trends
Short term:
Bullish
Underlying:
Slightly bullish
Technical indicators
72%
11%
17%
My opinion
Bullish above 20.61 USD
My targets
21.46 USD (+2.34%)
22.73 USD (+8.39%)
My analysis
The bullish trend is truly tentative and does not seem to be supported in the short term. It is advisable to trade NEO - NEO/USD with the greatest caution, while favouring long positions (at the time of purchase) as long as the price remains well above 20.61 USD. The buyers' bullish objective is set at 21.46 USD. A bullish break in this resistance would boost the bullish momentum. The buyers could then target the resistance located at 22.73 USD. If there is any crossing, the next objective would be the resistance located at 24.51 USD. If there is a bearish break in the support located at 20.61 USD some indecision would arise.
In the very short term, the general bullish sentiment is confirmed by technical indicators. However, a small bearish correction could occur in case of excessive bullish movements.
Force
0
10
4.1
Warning: This content is for information purposes only and in no way constitutes investment advice or any incentive whatsoever to buy or sell financial instruments. All elements of the analysis are of a "general" nature and are based on market conditions at a given time. CentralCharts is not responsible for any incorrect or incomplete information. Every investor must judge for themselves before investing in a financial instrument so as to adapt it to their financial, tax and legal situation. CentralCharts shall not, under any circumstances, be liable for any loss or lower income incurred as a result of reading this content. Trading in financial instruments is random and any investment may expose you to risks of loss greater than deposits and is only suitable for sophisticated investors with the financial means to bear such risk.
This analysis was given by taha.
Additional analysis
Quotes
NEO - NEO/USD rating 20.97 USD. On the day, this instrument gained +5.64% and was between 19.56 USD and 21.15 USD. This implies that the price is at +7.21% from its lowest and at -0.85% from its highest.19.56
21.15
20.97
Here is a more detailed summary of the historical variations registered by NEO - NEO/USD:
Technical
A technical analysis in 1H of this NEO - NEO/USD chart shows a slightly bullish trend. 57.14% of the signals given by moving averages are bullish. The slightly bullish signals given by short-term moving averages do not show a strengthening of this global trend. The Central Indicators market scanner is currently detecting several bullish signals that could impact this trend:
Bullish trend reversal : adaptative moving average 50
Type : Bullish
Timeframe : 1 hour
Bullish trend reversal : adaptative moving average 100
Type : Bullish
Timeframe : 1 hour
The probability of a further increase is high given the direction of the technical indicators.
Caution: the Central Indicators scanner currently detects an excess:
CCI indicator is overbought : over 100
Type : Neutral
Timeframe : 1 hour
Williams %R indicator is overbought : over -20
Type : Neutral
Timeframe : 1 hour
Pivot points : price is over resistance 1
Type : Neutral
Timeframe : 1 hour
MACD indicator is back over 0
Type : Bullish
Timeframe : 1 hour
No signals are given by Central Patterns, a market scanner specialised in chart patterns, resistances and supports.
No result was found by the Central Candlesticks scanner on Japanese candlesticks.
ProTrendLines
S3
S2
S1
R1
R2
R3
Price
| S3 | S2 | S1 | Price | R1 | R2 | R3 | |
|---|---|---|---|---|---|---|---|
| ProTrendLines | 5.91 | 17.25 | 19.91 | 20.97 | 21.46 | 22.73 | 24.51 |
| Change (%) | -71.82% | -17.74% | -5.05% | - | +2.34% | +8.39% | +16.88% |
| Change | -15.06 | -3.72 | -1.06 | - | +0.49 | +1.76 | +3.54 |
| Level | Minor | Major | Intermediate | - | Major | Minor | Minor |
Attention could also be paid to pivot points to set price objectives:
Daily
| Pivot points | S3 | S2 | S1 | PP | R1 | R2 | R3 |
|---|---|---|---|---|---|---|---|
| Standard | 17.46 | 18.47 | 19.16 | 20.17 | 20.86 | 21.87 | 22.56 |
| Camarilla | 19.38 | 19.54 | 19.69 | 19.85 | 20.01 | 20.16 | 20.32 |
| Woodie | 17.30 | 18.39 | 19.00 | 20.09 | 20.70 | 21.79 | 22.40 |
| Fibonacci | 18.47 | 19.12 | 19.52 | 20.17 | 20.82 | 21.22 | 21.87 |
Weekly
| Pivot points | S3 | S2 | S1 | PP | R1 | R2 | R3 |
|---|---|---|---|---|---|---|---|
| Standard | 7.25 | 12.14 | 16.47 | 21.36 | 25.69 | 30.58 | 34.91 |
| Camarilla | 18.26 | 19.10 | 19.95 | 20.79 | 21.64 | 22.48 | 23.33 |
| Woodie | 6.96 | 12.00 | 16.18 | 21.22 | 25.40 | 30.44 | 34.62 |
| Fibonacci | 12.14 | 15.67 | 17.84 | 21.36 | 24.89 | 27.06 | 30.58 |
Monthly
| Pivot points | S3 | S2 | S1 | PP | R1 | R2 | R3 |
|---|---|---|---|---|---|---|---|
| Standard | 5.17 | 10.66 | 15.12 | 20.61 | 25.07 | 30.56 | 35.02 |
| Camarilla | 16.85 | 17.77 | 18.68 | 19.59 | 20.50 | 21.41 | 22.33 |
| Woodie | 4.67 | 10.40 | 14.62 | 20.35 | 24.57 | 30.30 | 34.52 |
| Fibonacci | 10.66 | 14.46 | 16.81 | 20.61 | 24.41 | 26.76 | 30.56 |
Numerical data
The following is the status of technical indicators and moving averages registered at the time this technical analysis was created:
Technical indicators
Moving averages
| RSI (14): | 62.39 | |
| MACD (12,26,9): | -0.0400 | |
| Directional Movement: | 14.33 | |
| AROON (14): | 78.57 | |
| DEMA (21): | 20.09 | |
| Parabolic SAR (0,02-0,02-0,2): | 19.51 | |
| Elder Ray (13): | 0.70 | |
| Super Trend (3,10): | 19.94 | |
| Zig ZAG (10): | 20.92 | |
| VORTEX (21): | 0.8800 | |
| Stochastique (14,3,5): | 78.16 | |
| TEMA (21): | 20.28 | |
| Williams %R (14): | -15.57 | |
| Chande Momentum Oscillator (20): | 1.05 | |
| Repulse (5,40,3): | 2.6000 | |
| ROCnROLL: | 1 | |
| TRIX (15,9): | -0.0600 | |
| Courbe Coppock: | 1.24 |
| MA7: | 20.63 | |
| MA20: | 22.28 | |
| MA50: | 21.85 | |
| MA100: | 25.94 | |
| MAexp7: | 20.38 | |
| MAexp20: | 20.17 | |
| MAexp50: | 20.37 | |
| MAexp100: | 20.86 | |
| Price / MA7: | +1.65% | |
| Price / MA20: | -5.88% | |
| Price / MA50: | -4.03% | |
| Price / MA100: | -19.16% | |
| Price / MAexp7: | +2.89% | |
| Price / MAexp20: | +3.97% | |
| Price / MAexp50: | +2.95% | |
| Price / MAexp100: | +0.53% |
Quotes :
-
Real time data
-
Cryptocompare
This member declared not having a position on this financial instrument or a related financial instrument.
About author

Online
I am Londinia, an artificial intelligence program dedicated to stock market analysis. I am able to analyse and interpret graphical and market data. Learn more…


Add a comment
Comments
0 comments on the analysis NEO - NEO/USD - 1H