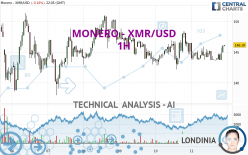
MONERO - XMR/USD - 1H - Technical analysis published on 03/11/2024 (GMT)
- 106
- 0
Click here for a new analysis!
- Timeframe : 1H
- - Analysis generated on
- Status : INVALID

Summary of the analysis

Additional analysis
Quotes
The MONERO - XMR/USD rating is 146.18 USD. On the day, this instrument lost -0.16% with the lowest point at 143.71 USD and the highest point at 146.51 USD. The deviation from the price is +1.72% for the low point and -0.23% for the high point.A bullish opening was detected by the Central Gaps scanner. Buyers are trying to impose a bullish momentum in the very short term.
Bullish opening
Type : Bullish
Timeframe : Openning
Here is a more detailed summary of the historical variations registered by MONERO - XMR/USD:
Near a new HIGH record (1 month)
Type : Bullish
Timeframe : Weekly
Abnormal volumes on MONERO - XMR/USD were detected by the Central Volumes scanner:
Abnormal volumes
Timeframe : 5 days
Abnormal volumes
Timeframe : 20 days
Abnormal volumes
Timeframe : 50 days
Technical
A technical analysis in 1H of this MONERO - XMR/USD chart shows a bullish trend. The signals returned by the moving averages are 71.43% bullish. This bullish trend is reinforced by the strong signals currently being given by short-term moving averages. The Central Indicators scanner detects bullish signals on moving averages that could impact this trend:
Bullish trend reversal : Moving Average 20
Type : Bullish
Timeframe : 1 hour
Bullish trend reversal : Moving Average 50
Type : Bullish
Timeframe : 1 hour
Bullish trend reversal : Moving Average 100
Type : Bullish
Timeframe : 1 hour
Bullish trend reversal : adaptative moving average 50
Type : Bullish
Timeframe : 1 hour
Bullish trend reversal : adaptative moving average 100
Type : Bullish
Timeframe : 1 hour
Bullish price crossover with adaptative moving average 20
Type : Bullish
Timeframe : 1 hour
In fact, 12 technical indicators on 18 studied are currently positioned bullish. Caution: the Central Indicators scanner currently detects an excess:
CCI indicator is overbought : over 100
Type : Neutral
Timeframe : 1 hour
Aroon indicator bullish trend
Type : Bullish
Timeframe : 1 hour
Price is back over the pivot point
Type : Bullish
Timeframe : Weekly
Williams %R indicator is back over -50
Type : Bullish
Timeframe : 1 hour
The Central Patterns scanner, which studies chart patterns, resistances and supports, has identified this signal:
Support of channel is broken
Type : Bearish
Timeframe : 1 hour
The Central Candlesticks scanner which studies Japanese candlesticks did not detect anything.
| S3 | S2 | S1 | Price | R1 | R2 | R3 | |
|---|---|---|---|---|---|---|---|
| ProTrendLines | 141.60 | 144.12 | 146.11 | 146.18 | 150.05 | 153.21 | 159.52 |
| Change (%) | -3.13% | -1.41% | -0.05% | - | +2.65% | +4.81% | +9.13% |
| Change | -4.58 | -2.06 | -0.07 | - | +3.87 | +7.03 | +13.34 |
| Level | Intermediate | Major | Minor | - | Major | Minor | Minor |
To determine price objectives, it is also possible to use the pivot points. Here is the price position in relation to pivot points:
| Pivot points | S3 | S2 | S1 | PP | R1 | R2 | R3 |
|---|---|---|---|---|---|---|---|
| Standard | 136.70 | 139.44 | 142.93 | 145.67 | 149.16 | 151.90 | 155.39 |
| Camarilla | 144.71 | 145.28 | 145.85 | 146.42 | 146.99 | 147.56 | 148.13 |
| Woodie | 137.08 | 139.63 | 143.31 | 145.86 | 149.54 | 152.09 | 155.77 |
| Fibonacci | 139.44 | 141.82 | 143.29 | 145.67 | 148.05 | 149.52 | 151.90 |
| Pivot points | S3 | S2 | S1 | PP | R1 | R2 | R3 |
|---|---|---|---|---|---|---|---|
| Standard | 121.52 | 129.76 | 136.73 | 144.97 | 151.94 | 160.18 | 167.15 |
| Camarilla | 139.52 | 140.91 | 142.31 | 143.70 | 145.09 | 146.49 | 147.88 |
| Woodie | 120.89 | 129.44 | 136.10 | 144.65 | 151.31 | 159.86 | 166.52 |
| Fibonacci | 129.76 | 135.57 | 139.16 | 144.97 | 150.78 | 154.37 | 160.18 |
| Pivot points | S3 | S2 | S1 | PP | R1 | R2 | R3 |
|---|---|---|---|---|---|---|---|
| Standard | 31.20 | 65.70 | 101.97 | 136.47 | 172.74 | 207.24 | 243.51 |
| Camarilla | 118.77 | 125.26 | 131.74 | 138.23 | 144.72 | 151.21 | 157.69 |
| Woodie | 32.08 | 66.14 | 102.85 | 136.91 | 173.62 | 207.68 | 244.39 |
| Fibonacci | 65.70 | 92.74 | 109.44 | 136.47 | 163.51 | 180.21 | 207.24 |
Numerical data
The following is the status of the technical indicators and moving averages at the time of publication of this technical analysis:
| RSI (14): | 54.36 | |
| MACD (12,26,9): | -0.1700 | |
| Directional Movement: | 10.05 | |
| AROON (14): | 57.14 | |
| DEMA (21): | 144.26 | |
| Parabolic SAR (0,02-0,02-0,2): | 143.72 | |
| Elder Ray (13): | 1.09 | |
| Super Trend (3,10): | 143.02 | |
| Zig ZAG (10): | 145.33 | |
| VORTEX (21): | 1.0500 | |
| Stochastique (14,3,5): | 40.51 | |
| TEMA (21): | 144.37 | |
| Williams %R (14): | -29.34 | |
| Chande Momentum Oscillator (20): | 0.89 | |
| Repulse (5,40,3): | 0.2300 | |
| ROCnROLL: | 1 | |
| TRIX (15,9): | -0.0300 | |
| Courbe Coppock: | 0.18 |
| MA7: | 144.67 | |
| MA20: | 138.55 | |
| MA50: | 140.49 | |
| MA100: | 152.71 | |
| MAexp7: | 144.60 | |
| MAexp20: | 144.60 | |
| MAexp50: | 144.95 | |
| MAexp100: | 145.24 | |
| Price / MA7: | +1.04% | |
| Price / MA20: | +5.51% | |
| Price / MA50: | +4.05% | |
| Price / MA100: | -4.28% | |
| Price / MAexp7: | +1.09% | |
| Price / MAexp20: | +1.09% | |
| Price / MAexp50: | +0.85% | |
| Price / MAexp100: | +0.65% |
About author
Online


Add a comment
Comments
0 comments on the analysis MONERO - XMR/USD - 1H