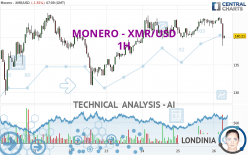
MONERO - XMR/USD - 1H - Technical analysis published on 03/26/2024 (GMT)
- 114
- 0
Click here for a new analysis!
- Timeframe : 1H
- - Analysis generated on
- Status : TARGET REACHED

Summary of the analysis

Additional analysis
Quotes
The MONERO - XMR/USD rating is 140.21 USD. On the day, this instrument lost -1.55% with the lowest point at 138.41 USD and the highest point at 143.62 USD. The deviation from the price is +1.30% for the low point and -2.37% for the high point.The Central Gaps scanner detects a bullish opening. A small advantage for buyers in the very short term.
Bullish opening
Type : Bullish
Timeframe : Openning
A study of price movements over other periods shows the following variations:
Abnormal volumes
Timeframe : 20 days
Abnormal volumes
Timeframe : 50 days
Technical
Technical analysis of MONERO - XMR/USD in 1H shows an overall bearish trend. 67.86% of the signals given by moving averages are bearish. The overall trend is reinforced by the strong bearish signals from short-term moving averages. The Central Indicators scanner detects bearish signals on moving averages that could impact this trend:
Bearish trend reversal : Moving Average 20
Type : Bearish
Timeframe : 1 hour
Bearish trend reversal : adaptative moving average 50
Type : Bearish
Timeframe : 1 hour
Bearish trend reversal : adaptative moving average 100
Type : Bearish
Timeframe : 1 hour
Bearish price crossover with Moving Average 100
Type : Bearish
Timeframe : 1 hour
Technical indicators are strongly bearish, suggesting that the price decline is expected to continue.
Caution: the Central Indicators scanner currently detects an excess:
CCI indicator is oversold : under -100
Type : Neutral
Timeframe : 1 hour
Williams %R indicator is oversold : under -80
Type : Neutral
Timeframe : 1 hour
Pivot points : price is under support 1
Type : Neutral
Timeframe : 1 hour
RSI indicator is back under 50
Type : Bearish
Timeframe : 1 hour
Parabolic SAR indicator bearish reversal
Type : Bearish
Timeframe : 1 hour
SuperTrend indicator bearish reversal
Type : Bearish
Timeframe : 1 hour
Central Patterns, the market scanner focusing on chart patterns, resistances and supports found this result:
Support of channel is broken
Type : Bearish
Timeframe : 1 hour
The presence of these Japanese chandelier patterns detected by Central Candlesticks that could impact the current short-term trend were also noted:
Bullish harami
Type : Bullish
Timeframe : 1 hour
Bullish harami cross
Type : Bullish
Timeframe : 1 hour
Long black line
Type : Bearish
Timeframe : 1 hour
| S3 | S2 | S1 | Price | R1 | R2 | R3 | |
|---|---|---|---|---|---|---|---|
| ProTrendLines | 133.98 | 137.78 | 139.74 | 140.21 | 141.75 | 143.34 | 150.11 |
| Change (%) | -4.44% | -1.73% | -0.34% | - | +1.10% | +2.23% | +7.06% |
| Change | -6.23 | -2.43 | -0.47 | - | +1.54 | +3.13 | +9.90 |
| Level | Major | Minor | Major | - | Intermediate | Intermediate | Intermediate |
To determine price objectives, it is also possible to use the pivot points. Here is the price position in relation to pivot points:
| Pivot points | S3 | S2 | S1 | PP | R1 | R2 | R3 |
|---|---|---|---|---|---|---|---|
| Standard | 136.70 | 138.23 | 140.32 | 141.85 | 143.94 | 145.47 | 147.56 |
| Camarilla | 141.43 | 141.76 | 142.09 | 142.42 | 142.75 | 143.08 | 143.42 |
| Woodie | 136.99 | 138.37 | 140.61 | 141.99 | 144.23 | 145.61 | 147.85 |
| Fibonacci | 138.23 | 139.61 | 140.46 | 141.85 | 143.23 | 144.08 | 145.47 |
| Pivot points | S3 | S2 | S1 | PP | R1 | R2 | R3 |
|---|---|---|---|---|---|---|---|
| Standard | 113.29 | 120.99 | 129.98 | 137.68 | 146.67 | 154.37 | 163.36 |
| Camarilla | 134.39 | 135.92 | 137.45 | 138.98 | 140.51 | 142.04 | 143.57 |
| Woodie | 113.95 | 121.31 | 130.64 | 138.00 | 147.33 | 154.69 | 164.02 |
| Fibonacci | 120.99 | 127.36 | 131.30 | 137.68 | 144.05 | 147.99 | 154.37 |
| Pivot points | S3 | S2 | S1 | PP | R1 | R2 | R3 |
|---|---|---|---|---|---|---|---|
| Standard | 37.16 | 68.68 | 103.46 | 134.98 | 169.76 | 201.28 | 236.06 |
| Camarilla | 120.00 | 126.08 | 132.15 | 138.23 | 144.31 | 150.39 | 156.46 |
| Woodie | 38.78 | 69.50 | 105.08 | 135.80 | 171.38 | 202.10 | 237.68 |
| Fibonacci | 68.68 | 94.01 | 109.66 | 134.98 | 160.31 | 175.96 | 201.28 |
Numerical data
The following is the status of technical indicators and moving averages registered at the time this technical analysis was created:
| RSI (14): | 35.59 | |
| MACD (12,26,9): | -0.0300 | |
| Directional Movement: | -26.85 | |
| AROON (14): | -14.29 | |
| DEMA (21): | 142.21 | |
| Parabolic SAR (0,02-0,02-0,2): | 143.52 | |
| Elder Ray (13): | -2.07 | |
| Super Trend (3,10): | 142.90 | |
| Zig ZAG (10): | 140.16 | |
| VORTEX (21): | 0.9600 | |
| Stochastique (14,3,5): | 32.41 | |
| TEMA (21): | 141.79 | |
| Williams %R (14): | -66.03 | |
| Chande Momentum Oscillator (20): | -2.54 | |
| Repulse (5,40,3): | -1.2300 | |
| ROCnROLL: | 2 | |
| TRIX (15,9): | 0.0400 | |
| Courbe Coppock: | 1.03 |
| MA7: | 139.47 | |
| MA20: | 142.08 | |
| MA50: | 134.46 | |
| MA100: | 148.19 | |
| MAexp7: | 141.64 | |
| MAexp20: | 142.27 | |
| MAexp50: | 141.47 | |
| MAexp100: | 140.61 | |
| Price / MA7: | +0.53% | |
| Price / MA20: | -1.32% | |
| Price / MA50: | +4.28% | |
| Price / MA100: | -5.38% | |
| Price / MAexp7: | -1.01% | |
| Price / MAexp20: | -1.45% | |
| Price / MAexp50: | -0.89% | |
| Price / MAexp100: | -0.28% |
About author
Online


Add a comment
Comments
0 comments on the analysis MONERO - XMR/USD - 1H