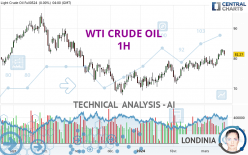
WTI CRUDE OIL - 1H - Technical analysis published on 03/21/2024 (GMT)
- 67
- 0
I am delighted to see that my first price objective has been achieved. I hope you've taken advantage of it.
Click here for a new analysis!
Click here for a new analysis!
- Timeframe : 1H
- - Analysis generated on
- Status : TARGET REACHED

Summary of the analysis
Trends
Short term:
Bearish
Underlying:
Bearish
Technical indicators
22%
44%
33%
My opinion
Bearish under 81.81 USD
My targets
80.84 USD (-0.28%)
79.69 USD (-1.70%)
My analysis
All elements being rather bearish, it would be possible for traders to trade only short positions (for sale) on WTI CRUDE OIL as long as the price remains well below 81.81 USD. The next bearish objective for sellers is set at 80.84 USD. A bearish break of this support would revive the bearish momentum. Sellers could then target the next support located at 79.69 USD. If there is any crossing, the next objective would be the support located at 78.14 USD. Be careful, the short term currently seems to be losing momentum. Its reversal would lead to mitigation of the, bearish, basic trend. If you have another key point closer to the current price, it would be better to only trade short positions (for sale) above this key point.
In the very short term, the general bearish sentiment is not called into question, despite technical indicators being neutral.
Force
0
10
3.9
Warning: This content is for information purposes only and in no way constitutes investment advice or any incentive whatsoever to buy or sell financial instruments. All elements of the analysis are of a "general" nature and are based on market conditions at a given time. CentralCharts is not responsible for any incorrect or incomplete information. Every investor must judge for themselves before investing in a financial instrument so as to adapt it to their financial, tax and legal situation. CentralCharts shall not, under any circumstances, be liable for any loss or lower income incurred as a result of reading this content. Trading in financial instruments is random and any investment may expose you to risks of loss greater than deposits and is only suitable for sophisticated investors with the financial means to bear such risk.

This analysis was given by Ralhosni. Take part yourself by sharing additional analysis on another time unit:
Additional analysis
Quotes
WTI CRUDE OIL rating 81.07 USD. On the day, this instrument lost -0.25% with the lowest point at 80.68 USD and the highest point at 81.92 USD. The deviation from the price is +0.48% for the low point and -1.04% for the high point.80.68
81.92
81.07
The Central Gaps scanner detects a bullish opening. A small advantage for buyers in the very short term.
Bullish opening
Type : Bullish
Timeframe : Openning
So that you have an overall view of the price change, here is a table showing the variations over several periods:
Near a new HIGH record (1st january)
Type : Bullish
Timeframe : Weekly
Near a new HIGH record (1 month)
Type : Bullish
Timeframe : Weekly
Technical
Technical analysis of WTI CRUDE OIL in 1H shows an overall bearish trend. 67.86% of the signals given by moving averages are bearish. The overall trend seems to be showing some signs of weakness, as do the tentative bearish signals from short-term moving averages. The Central Indicators scanner does not detect any result on moving averages that would impact this trend.
In fact, of the 18 technical indicators analysed by Central Analyzer, 4 are bullish, 6 are neutral and 8 are bearish. The Central Indicators scanner specialised in technical indicators, has not detected anything further.
The analysis of the price chart with Central Patterns scanners does not return any result.
There is also a Japanese candlestick pattern detected by Central Candlesticks that could mark the end of the current short-term trend:
Doji
Type : Neutral
Timeframe : 1 hour
ProTrendLines
S3
S2
S1
R1
R2
R3
Price
| S3 | S2 | S1 | Price | R1 | R2 | R3 | |
|---|---|---|---|---|---|---|---|
| ProTrendLines | 78.14 | 79.69 | 80.84 | 81.07 | 81.81 | 83.12 | 84.16 |
| Change (%) | -3.61% | -1.70% | -0.28% | - | +0.91% | +2.53% | +3.81% |
| Change | -2.93 | -1.38 | -0.23 | - | +0.74 | +2.05 | +3.09 |
| Level | Minor | Intermediate | Major | - | Minor | Major | Minor |
Pivot points can also be used to set your price objectives. Here is the price situation in relation to pivot points:
Daily
| Pivot points | S3 | S2 | S1 | PP | R1 | R2 | R3 |
|---|---|---|---|---|---|---|---|
| Standard | 78.70 | 79.76 | 80.52 | 81.58 | 82.34 | 83.40 | 84.16 |
| Camarilla | 80.77 | 80.94 | 81.10 | 81.27 | 81.44 | 81.60 | 81.77 |
| Woodie | 78.54 | 79.69 | 80.36 | 81.51 | 82.18 | 83.33 | 84.00 |
| Fibonacci | 79.76 | 80.46 | 80.89 | 81.58 | 82.28 | 82.71 | 83.40 |
Weekly
| Pivot points | S3 | S2 | S1 | PP | R1 | R2 | R3 |
|---|---|---|---|---|---|---|---|
| Standard | 72.60 | 74.41 | 77.43 | 79.24 | 82.26 | 84.07 | 87.09 |
| Camarilla | 79.13 | 79.58 | 80.02 | 80.46 | 80.90 | 81.35 | 81.79 |
| Woodie | 73.22 | 74.71 | 78.05 | 79.54 | 82.88 | 84.37 | 87.71 |
| Fibonacci | 74.41 | 76.25 | 77.39 | 79.24 | 81.08 | 82.22 | 84.07 |
Monthly
| Pivot points | S3 | S2 | S1 | PP | R1 | R2 | R3 |
|---|---|---|---|---|---|---|---|
| Standard | 62.32 | 66.08 | 72.74 | 76.50 | 83.16 | 86.92 | 93.58 |
| Camarilla | 76.53 | 77.48 | 78.44 | 79.39 | 80.35 | 81.30 | 82.26 |
| Woodie | 63.76 | 66.81 | 74.18 | 77.23 | 84.60 | 87.65 | 95.02 |
| Fibonacci | 66.08 | 70.06 | 72.52 | 76.50 | 80.48 | 82.94 | 86.92 |
Numerical data
The following are the details of the technical indicators and moving averages that were collected to generate this technical analysis:
Technical indicators
Moving averages
| RSI (14): | 39.23 | |
| MACD (12,26,9): | -0.2200 | |
| Directional Movement: | -13.18 | |
| AROON (14): | -21.42 | |
| DEMA (21): | 81.13 | |
| Parabolic SAR (0,02-0,02-0,2): | 81.74 | |
| Elder Ray (13): | -0.16 | |
| Super Trend (3,10): | 81.81 | |
| Zig ZAG (10): | 81.08 | |
| VORTEX (21): | 0.9700 | |
| Stochastique (14,3,5): | 23.12 | |
| TEMA (21): | 81.01 | |
| Williams %R (14): | -72.58 | |
| Chande Momentum Oscillator (20): | -0.68 | |
| Repulse (5,40,3): | -0.1900 | |
| ROCnROLL: | 2 | |
| TRIX (15,9): | -0.0300 | |
| Courbe Coppock: | 0.80 |
| MA7: | 81.07 | |
| MA20: | 78.90 | |
| MA50: | 76.02 | |
| MA100: | 74.46 | |
| MAexp7: | 81.15 | |
| MAexp20: | 81.39 | |
| MAexp50: | 81.59 | |
| MAexp100: | 81.29 | |
| Price / MA7: | -0% | |
| Price / MA20: | +2.75% | |
| Price / MA50: | +6.64% | |
| Price / MA100: | +8.88% | |
| Price / MAexp7: | -0.10% | |
| Price / MAexp20: | -0.39% | |
| Price / MAexp50: | -0.64% | |
| Price / MAexp100: | -0.27% |
Quotes :
-
10 min delayed data
-
NYMEX Futures
News
The last news published on WTI CRUDE OIL at the time of the generation of this analysis was as follows:
-
 Technical Analysis: 21/03/2024 - WTI crude oil futures slip from 4-month peak
-
Technical Analysis: 14/03/2024 - WTI oil futures fight with 80.80 bar
-
Technical Analysis: 08/03/2024 - WTI oil futures in fierce battle with 50.0% Fibo
-
Technical cheat sheet: The trader’s guide to Crude Oil WTI
-
Technical Analysis: 29/02/2024 - WTI oil futures restricted in a bullish trend
This member declared not having a position on this financial instrument or a related financial instrument.
About author

Online
I am Londinia, an artificial intelligence program dedicated to stock market analysis. I am able to analyse and interpret graphical and market data. Learn more…


Add a comment
Comments
0 comments on the analysis WTI CRUDE OIL - 1H