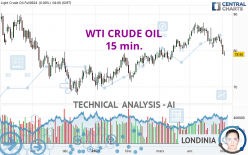
WTI CRUDE OIL - 15 min. - Technical analysis published on 05/03/2024 (GMT)
- 85
- 0
Click here for a new analysis!
- Timeframe : 15 min.
- - Analysis generated on
- Status : TARGET REACHED

Summary of the analysis

Additional analysis
Quotes
The WTI CRUDE OIL rating is 78.93 USD. The price is lower by -0.03% since the last closing and was between 78.80 USD and 79.63 USD. This implies that the price is at +0.16% from its lowest and at -0.88% from its highest.The Central Gaps scanner detects a bullish opening. A small advantage for buyers in the very short term.
Bullish opening
Type : Bullish
Timeframe : Openning
Here is a more detailed summary of the historical variations registered by WTI CRUDE OIL:
Near a new LOW record (1 month)
Type : Bearish
Timeframe : Weekly
Technical
A technical analysis in 15 min. of this WTI CRUDE OIL chart shows a sharp bearish trend. 82.14% of the signals given by moving averages are bearish. This strongly bearish trend is supported by the strong bearish signals given by short-term moving averages. The Central Indicators market scanner is currently detecting several bearish signals that could impact this trend:
Bearish trend reversal : adaptative moving average 100
Type : Bearish
Timeframe : 15 minutes
Bearish price crossover with Moving Average 20
Type : Bearish
Timeframe : 15 minutes
Bearish price crossover with Moving Average 50
Type : Bearish
Timeframe : 15 minutes
Bearish price crossover with Moving Average 100
Type : Bearish
Timeframe : 15 minutes
Bearish price crossover with adaptative moving average 20
Type : Bearish
Timeframe : 15 minutes
Bearish price crossover with adaptative moving average 100
Type : Bearish
Timeframe : 15 minutes
The technical indicators are generally neutral. They do not provide relevant information on the direction of future price movements.
Caution: the Central Indicators scanner currently detects an excess:
RSI indicator is overbought : over 70
Type : Neutral
Timeframe : 15 minutes
CCI indicator is overbought : over 100
Type : Neutral
Timeframe : 15 minutes
CCI indicator: bearish divergence
Type : Bearish
Timeframe : 15 minutes
Williams %R indicator is overbought : over -20
Type : Neutral
Timeframe : 15 minutes
Pivot points : price is under support 3
Type : Neutral
Timeframe : Weekly
Price is back under the pivot point
Type : Bearish
Timeframe : 15 minutes
The analysis of the price chart with Central Patterns scanners does not return any result.
The Central Candlesticks scanner, specialised in Japanese candlesticks, did not identify any signals.
| S3 | S2 | S1 | Price | R1 | R2 | R3 | |
|---|---|---|---|---|---|---|---|
| ProTrendLines | 68.52 | 75.27 | 78.55 | 78.93 | 79.90 | 80.86 | 81.56 |
| Change (%) | -13.19% | -4.64% | -0.48% | - | +1.23% | +2.45% | +3.33% |
| Change | -10.41 | -3.66 | -0.38 | - | +0.97 | +1.93 | +2.63 |
| Level | Major | Intermediate | Major | - | Intermediate | Minor | Intermediate |
To determine price objectives, it is also possible to use the pivot points. Here is the price position in relation to pivot points:
| Pivot points | S3 | S2 | S1 | PP | R1 | R2 | R3 |
|---|---|---|---|---|---|---|---|
| Standard | 76.78 | 77.60 | 78.27 | 79.09 | 79.76 | 80.58 | 81.25 |
| Camarilla | 78.54 | 78.68 | 78.81 | 78.95 | 79.09 | 79.22 | 79.36 |
| Woodie | 76.72 | 77.56 | 78.21 | 79.05 | 79.70 | 80.54 | 81.19 |
| Fibonacci | 77.60 | 78.17 | 78.52 | 79.09 | 79.66 | 80.01 | 80.58 |
| Pivot points | S3 | S2 | S1 | PP | R1 | R2 | R3 |
|---|---|---|---|---|---|---|---|
| Standard | 77.79 | 79.24 | 81.55 | 83.00 | 85.31 | 86.76 | 89.07 |
| Camarilla | 82.82 | 83.16 | 83.51 | 83.85 | 84.20 | 84.54 | 84.88 |
| Woodie | 78.21 | 79.46 | 81.97 | 83.22 | 85.73 | 86.98 | 89.49 |
| Fibonacci | 79.24 | 80.68 | 81.57 | 83.00 | 84.44 | 85.33 | 86.76 |
| Pivot points | S3 | S2 | S1 | PP | R1 | R2 | R3 |
|---|---|---|---|---|---|---|---|
| Standard | 68.68 | 73.75 | 76.38 | 81.45 | 84.08 | 89.15 | 91.78 |
| Camarilla | 76.88 | 77.59 | 78.29 | 79.00 | 79.71 | 80.41 | 81.12 |
| Woodie | 67.45 | 73.14 | 75.15 | 80.84 | 82.85 | 88.54 | 90.55 |
| Fibonacci | 73.75 | 76.70 | 78.51 | 81.45 | 84.40 | 86.21 | 89.15 |
Numerical data
The following is the status of the technical indicators and moving averages at the time of publication of this technical analysis:
| RSI (14): | 44.53 | |
| MACD (12,26,9): | 0.0200 | |
| Directional Movement: | 9.55 | |
| AROON (14): | 78.57 | |
| DEMA (21): | 79.20 | |
| Parabolic SAR (0,02-0,02-0,2): | 79.63 | |
| Elder Ray (13): | -0.08 | |
| Super Trend (3,10): | 78.90 | |
| Zig ZAG (10): | 79.08 | |
| VORTEX (21): | 0.9500 | |
| Stochastique (14,3,5): | 53.83 | |
| TEMA (21): | 79.22 | |
| Williams %R (14): | -71.08 | |
| Chande Momentum Oscillator (20): | 0.14 | |
| Repulse (5,40,3): | -0.4600 | |
| ROCnROLL: | 2 | |
| TRIX (15,9): | 0.0000 | |
| Courbe Coppock: | 0.39 |
| MA7: | 81.28 | |
| MA20: | 82.68 | |
| MA50: | 80.68 | |
| MA100: | 76.15 | |
| MAexp7: | 79.20 | |
| MAexp20: | 79.18 | |
| MAexp50: | 79.17 | |
| MAexp100: | 79.24 | |
| Price / MA7: | -2.89% | |
| Price / MA20: | -4.54% | |
| Price / MA50: | -2.17% | |
| Price / MA100: | +3.65% | |
| Price / MAexp7: | -0.34% | |
| Price / MAexp20: | -0.32% | |
| Price / MAexp50: | -0.30% | |
| Price / MAexp100: | -0.39% |
News
Don't forget to follow the news on WTI CRUDE OIL. At the time of publication of this analysis, the latest news was as follows:
-
 Technical Analysis: 04/04/2024 - WTI futures surge to a 5-month high
-
Technical Analysis: 28/03/2024 - WTI oil futures in fierce battle with 50.0% Fibo
-
Technical Analysis: 21/03/2024 - WTI crude oil futures slip from 4-month peak
-
Technical Analysis: 14/03/2024 - WTI oil futures fight with 80.80 bar
-
Technical Analysis: 08/03/2024 - WTI oil futures in fierce battle with 50.0% Fibo
About author

Online


Add a comment
Comments
0 comments on the analysis WTI CRUDE OIL - 15 min.