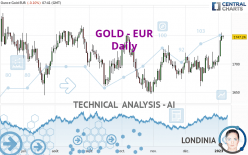
GOLD - EUR - Daily - Technical analysis published on 01/05/2023 (GMT)
- 152
- 0
Click here for a new analysis!
- Timeframe : Daily
- - Analysis generated on
- Status : TARGET REACHED

Summary of the analysis

Additional analysis
Quotes
The GOLD - EUR price is 1,747.24 EUR. The price registered a decrease of -0.10% on the session and was traded between 1,744.23 EUR and 1,750.56 EUR over the period. The price is currently at +0.17% from its lowest and -0.19% from its highest.A bullish opening was detected by the Central Gaps scanner. Buyers are trying to impose a bullish momentum in the very short term.
Bullish opening
Type : Bullish
Timeframe : Openning
Here is a more detailed summary of the historical variations registered by GOLD - EUR:
Near a new LOW record (1st january)
Type : Bearish
Timeframe : Weekly
Near a new LOW record (1 month)
Type : Bearish
Timeframe : Weekly
The Central Volumes scanner notes the presence of abnormal volumes:
Abnormal volumes
Timeframe : 5 days
Abnormal volumes
Timeframe : 20 days
Abnormal volumes
Timeframe : 50 days
Technical
A technical analysis in Daily of this GOLD - EUR chart shows a strongly bullish trend. The signals given by the moving averages are 85.71% bullish. This strong bullish trend is confirmed by the strong signals currently being given by short-term moving averages. The Central Indicators market scanner is currently detecting a bullish signal that could impact this trend:
Bullish trend reversal : Moving Average 100
Type : Bullish
Timeframe : Daily
In fact, 17 technical indicators on 18 studied are currently positioned bullish. Caution: the Central Indicators scanner currently detects an excess:
CCI indicator is overbought : over 100
Type : Neutral
Timeframe : Daily
Previous candle closed over Bollinger bands
Type : Neutral
Timeframe : Daily
Williams %R indicator is overbought : over -20
Type : Neutral
Timeframe : Daily
Pivot points : price is over resistance 2
Type : Neutral
Timeframe : Weekly
Price is back under the pivot point
Type : Bearish
Timeframe : Daily
The analysis of the price chart with Central Patterns scanners does not return any result.
No result was found by the Central Candlesticks scanner on Japanese candlesticks.
| S3 | S2 | S1 | Price | R1 | R2 | R3 | |
|---|---|---|---|---|---|---|---|
| ProTrendLines | 1,681.89 | 1,711.04 | 1,742.59 | 1,747.24 | 1,779.13 | 1,804.83 | 1,834.12 |
| Change (%) | -3.74% | -2.07% | -0.27% | - | +1.83% | +3.30% | +4.97% |
| Change | -65.35 | -36.20 | -4.65 | - | +31.89 | +57.59 | +86.88 |
| Level | Minor | Major | Major | - | Major | Minor | Minor |
Attention could also be paid to pivot points to set price objectives:
| Pivot points | S3 | S2 | S1 | PP | R1 | R2 | R3 |
|---|---|---|---|---|---|---|---|
| Standard | 1,726.57 | 1,733.57 | 1,741.24 | 1,748.24 | 1,755.91 | 1,762.91 | 1,770.58 |
| Camarilla | 1,744.88 | 1,746.22 | 1,747.57 | 1,748.91 | 1,750.26 | 1,751.60 | 1,752.94 |
| Woodie | 1,726.91 | 1,733.74 | 1,741.58 | 1,748.41 | 1,756.25 | 1,763.08 | 1,770.92 |
| Fibonacci | 1,733.57 | 1,739.17 | 1,742.64 | 1,748.24 | 1,753.84 | 1,757.31 | 1,762.91 |
| Pivot points | S3 | S2 | S1 | PP | R1 | R2 | R3 |
|---|---|---|---|---|---|---|---|
| Standard | 1,659.62 | 1,675.04 | 1,690.25 | 1,705.67 | 1,720.88 | 1,736.30 | 1,751.51 |
| Camarilla | 1,697.04 | 1,699.85 | 1,702.65 | 1,705.46 | 1,708.27 | 1,711.08 | 1,713.88 |
| Woodie | 1,659.52 | 1,674.99 | 1,690.15 | 1,705.62 | 1,720.78 | 1,736.25 | 1,751.41 |
| Fibonacci | 1,675.04 | 1,686.74 | 1,693.97 | 1,705.67 | 1,717.37 | 1,724.60 | 1,736.30 |
| Pivot points | S3 | S2 | S1 | PP | R1 | R2 | R3 |
|---|---|---|---|---|---|---|---|
| Standard | 1,609.89 | 1,635.25 | 1,670.36 | 1,695.72 | 1,730.83 | 1,756.19 | 1,791.30 |
| Camarilla | 1,688.83 | 1,694.37 | 1,699.92 | 1,705.46 | 1,711.00 | 1,716.55 | 1,722.09 |
| Woodie | 1,614.76 | 1,637.69 | 1,675.23 | 1,698.16 | 1,735.70 | 1,758.63 | 1,796.17 |
| Fibonacci | 1,635.25 | 1,658.35 | 1,672.62 | 1,695.72 | 1,718.82 | 1,733.09 | 1,756.19 |
Numerical data
The following are the details of the technical indicators and moving averages that were collected to generate this technical analysis:
| RSI (14): | 66.02 | |
| MACD (12,26,9): | 10.9400 | |
| Directional Movement: | 22.32 | |
| AROON (14): | 92.86 | |
| DEMA (21): | 1,723.21 | |
| Parabolic SAR (0,02-0,02-0,2): | 1,685.69 | |
| Elder Ray (13): | 29.66 | |
| Super Trend (3,10): | 1,696.67 | |
| Zig ZAG (10): | 1,747.69 | |
| VORTEX (21): | 1.1600 | |
| Stochastique (14,3,5): | 91.95 | |
| TEMA (21): | 1,732.30 | |
| Williams %R (14): | -9.89 | |
| Chande Momentum Oscillator (20): | 37.70 | |
| Repulse (5,40,3): | 1.3500 | |
| ROCnROLL: | 1 | |
| TRIX (15,9): | 0.0400 | |
| Courbe Coppock: | 3.64 |
| MA7: | 1,722.66 | |
| MA20: | 1,705.12 | |
| MA50: | 1,696.92 | |
| MA100: | 1,701.29 | |
| MAexp7: | 1,728.58 | |
| MAexp20: | 1,711.33 | |
| MAexp50: | 1,702.79 | |
| MAexp100: | 1,703.67 | |
| Price / MA7: | +1.43% | |
| Price / MA20: | +2.47% | |
| Price / MA50: | +2.97% | |
| Price / MA100: | +2.70% | |
| Price / MAexp7: | +1.08% | |
| Price / MAexp20: | +2.10% | |
| Price / MAexp50: | +2.61% | |
| Price / MAexp100: | +2.56% |
About author

Online


Add a comment
Comments
0 comments on the analysis GOLD - EUR - Daily