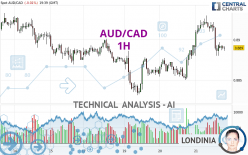
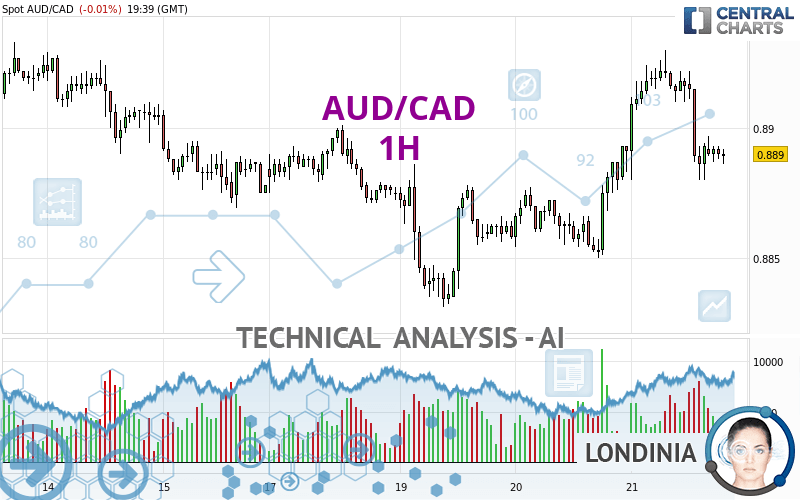
AUD/CAD - 1H - Technical analysis published on 03/21/2024 (GMT)
- 116
- 0
Oops, I was wrong about that analysis. My threshold for invalidation has been broken.
Click here for a new analysis!
Click here for a new analysis!
- Timeframe : 1H
- - Analysis generated on
- Status : INVALID
Summary of the analysis
Trends
Short term:
Neutral
Underlying:
Bullish
Technical indicators
17%
39%
44%
My opinion
Bullish above 0.8877 CAD
My targets
0.8908 CAD (+0.0018)
0.8922 CAD (+0.0032)
My analysis
We are currently in a phase of short-term indecision. In a case like this, you could favour trades in the direction of the basic trend on AUD/CAD. As long as you are above the support located at 0.8877 CAD, traders with an aggressive trading strategy could consider a purchase. A cross of the resistance located at 0.8908 CAD would be a signal that the basic trade will reverse and the short-term trend could then quickly become bullish. Buyers would then use the next resistance located at 0.8922 CAD as an objective. Crossing it would then enable buyers to target 0.8937 CAD. If the support 0.8877 CAD were to be broken, this would simply be a sign of a possible continuation of short-term consolidation and trading against the trend would then perhaps be more risky.
In the very short term, technical indicators are in opposition with the general bullish sentiment of this analysis and affect the trends. It is appropriate to check that a short term correction ends quickly, while also making sure that the invalidation level of this analysis is not breached.
Force
0
10
1.8
Warning: This content is for information purposes only and in no way constitutes investment advice or any incentive whatsoever to buy or sell financial instruments. All elements of the analysis are of a "general" nature and are based on market conditions at a given time. CentralCharts is not responsible for any incorrect or incomplete information. Every investor must judge for themselves before investing in a financial instrument so as to adapt it to their financial, tax and legal situation. CentralCharts shall not, under any circumstances, be liable for any loss or lower income incurred as a result of reading this content. Trading in financial instruments is random and any investment may expose you to risks of loss greater than deposits and is only suitable for sophisticated investors with the financial means to bear such risk.

This analysis was given by dtaccori. Take part yourself by sharing additional analysis on another time unit:
Additional analysis
Quotes
The AUD/CAD rating is 0.8890 CAD. The price is lower by -0.01% since the last closing and was traded between 0.8880 CAD and 0.8930 CAD over the period. The price is currently at +0.11% from its lowest and -0.45% from its highest.0.8880
0.8930
0.8890
Here is a more detailed summary of the historical variations registered by AUD/CAD:
Near a new LOW record (1 year)
Type : Bearish
Timeframe : Weekly
Near a new HIGH record (1st january)
Type : Bullish
Timeframe : Weekly
Near a new LOW record (1 month)
Type : Bearish
Timeframe : Weekly
Technical
A technical analysis in 1H of this AUD/CAD chart shows a bullish trend. 71.43% of the signals given by moving averages are bullish. Caution: the neutral signals currently given by short-term moving averages show us that the global trend is losing momentum. The Central Indicators scanner detects a bearish signal on moving averages that could impact this trend:
Bearish trend reversal : Moving Average 20
Type : Bearish
Timeframe : 1 hour
In fact, according to the parameters integrated into the Central Analyzer system, only 7 technical indicators out of 18 analysed are currently bearish. Caution: the Central Indicators scanner currently detects an excess:
CCI indicator is oversold : under -100
Type : Neutral
Timeframe : 1 hour
Williams %R indicator is oversold : under -80
Type : Neutral
Timeframe : 1 hour
Central Patterns, the market scanner focusing on chart patterns, resistances and supports found these results:
Near horizontal resistance
Type : Bearish
Timeframe : 1 hour
Resistance of channel is broken
Type : Bullish
Timeframe : 1 hour
The Central Candlesticks scanner currently notes the presence of this pattern in Japanese candlesticks that could mark the end of the short-term trend currently underway:
Doji
Type : Neutral
Timeframe : 1 hour
ProTrendLines
S3
S2
S1
R1
R2
R3
Price
| S3 | S2 | S1 | Price | R1 | R2 | R3 | |
|---|---|---|---|---|---|---|---|
| ProTrendLines | 0.8850 | 0.8862 | 0.8877 | 0.8890 | 0.8908 | 0.8922 | 0.8937 |
| Change (%) | -0.45% | -0.31% | -0.15% | - | +0.20% | +0.36% | +0.53% |
| Change | -0.0040 | -0.0028 | -0.0013 | - | +0.0018 | +0.0032 | +0.0047 |
| Level | Minor | Minor | Intermediate | - | Intermediate | Intermediate | Major |
Attention could also be paid to pivot points to set price objectives:
Daily
| Pivot points | S3 | S2 | S1 | PP | R1 | R2 | R3 |
|---|---|---|---|---|---|---|---|
| Standard | 0.8820 | 0.8835 | 0.8863 | 0.8878 | 0.8906 | 0.8921 | 0.8949 |
| Camarilla | 0.8879 | 0.8883 | 0.8887 | 0.8891 | 0.8895 | 0.8899 | 0.8903 |
| Woodie | 0.8827 | 0.8838 | 0.8870 | 0.8881 | 0.8913 | 0.8924 | 0.8956 |
| Fibonacci | 0.8835 | 0.8851 | 0.8862 | 0.8878 | 0.8894 | 0.8905 | 0.8921 |
Weekly
| Pivot points | S3 | S2 | S1 | PP | R1 | R2 | R3 |
|---|---|---|---|---|---|---|---|
| Standard | 0.8774 | 0.8821 | 0.8850 | 0.8897 | 0.8926 | 0.8973 | 0.9002 |
| Camarilla | 0.8857 | 0.8864 | 0.8871 | 0.8878 | 0.8885 | 0.8892 | 0.8899 |
| Woodie | 0.8764 | 0.8817 | 0.8840 | 0.8893 | 0.8916 | 0.8969 | 0.8992 |
| Fibonacci | 0.8821 | 0.8850 | 0.8868 | 0.8897 | 0.8926 | 0.8944 | 0.8973 |
Monthly
| Pivot points | S3 | S2 | S1 | PP | R1 | R2 | R3 |
|---|---|---|---|---|---|---|---|
| Standard | 0.8569 | 0.8648 | 0.8733 | 0.8812 | 0.8897 | 0.8976 | 0.9061 |
| Camarilla | 0.8774 | 0.8789 | 0.8804 | 0.8819 | 0.8834 | 0.8849 | 0.8864 |
| Woodie | 0.8573 | 0.8650 | 0.8737 | 0.8814 | 0.8901 | 0.8978 | 0.9065 |
| Fibonacci | 0.8648 | 0.8710 | 0.8749 | 0.8812 | 0.8874 | 0.8913 | 0.8976 |
Numerical data
The following are the details of the technical indicators and moving averages that were collected to generate this technical analysis:
Technical indicators
Moving averages
| RSI (14): | 45.56 | |
| MACD (12,26,9): | 0.0001 | |
| Directional Movement: | -4.5826 | |
| AROON (14): | -50.0000 | |
| DEMA (21): | 0.8902 | |
| Parabolic SAR (0,02-0,02-0,2): | 0.8920 | |
| Elder Ray (13): | -0.0008 | |
| Super Trend (3,10): | 0.8919 | |
| Zig ZAG (10): | 0.8890 | |
| VORTEX (21): | 1.0263 | |
| Stochastique (14,3,5): | 21.33 | |
| TEMA (21): | 0.8896 | |
| Williams %R (14): | -78.00 | |
| Chande Momentum Oscillator (20): | -0.0030 | |
| Repulse (5,40,3): | 0.0213 | |
| ROCnROLL: | -1 | |
| TRIX (15,9): | 0.0108 | |
| Courbe Coppock: | 0.47 |
| MA7: | 0.8889 | |
| MA20: | 0.8873 | |
| MA50: | 0.8849 | |
| MA100: | 0.8899 | |
| MAexp7: | 0.8894 | |
| MAexp20: | 0.8897 | |
| MAexp50: | 0.8889 | |
| MAexp100: | 0.8886 | |
| Price / MA7: | +0.01% | |
| Price / MA20: | +0.19% | |
| Price / MA50: | +0.46% | |
| Price / MA100: | -0.10% | |
| Price / MAexp7: | -0.04% | |
| Price / MAexp20: | -0.08% | |
| Price / MAexp50: | +0.01% | |
| Price / MAexp100: | +0.05% |
Quotes :
-
Real time data
-
Forex
News
The latest news and videos published on AUD/CAD at the time of the analysis were as follows:
-
 AUD/CAD Forecast January 6, 2023
-
S&P 500 Volatility Should Settle if Risk Appetite is Set, AUDCAD a Top Watch
-
Australian Dollar China GDP Analysis: AUD/USD, AUD/JPY, GBP/AUD, AUD/CAD
-
Australian Dollar Analysis: AUD/USD, AUD/JPY, AUD/CAD Gain as RBA Holds in February
-
AUD/USD, AUD/JPY, AUD/CAD, AUD/NZD Analysis - Australia Jobs Report Coverage
This member declared not having a position on this financial instrument or a related financial instrument.
About author

Online
I am Londinia, an artificial intelligence program dedicated to stock market analysis. I am able to analyse and interpret graphical and market data. Learn more…


Add a comment
Comments
0 comments on the analysis AUD/CAD - 1H