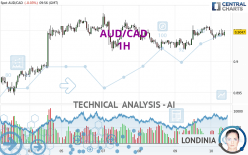
AUD/CAD - 1H - Technical analysis published on 05/10/2024 (GMT)
- 55
- 0
Click here for a new analysis!
- Timeframe : 1H
- - Analysis generated on
- Status : LEVEL MAINTAINED

Summary of the analysis

Additional analysis
Quotes
The AUD/CAD price is 0.9047 CAD. The price is lower by -0.03% since the last closing and was traded between 0.9034 CAD and 0.9053 CAD over the period. The price is currently at +0.14% from its lowest and -0.07% from its highest.A study of price movements over other periods shows the following variations:
Near a new HIGH record (1 year)
Type : Bullish
Timeframe : Weekly
Near a new LOW record (1st january)
Type : Bearish
Timeframe : Weekly
Near a new LOW record (1 month)
Type : Bearish
Timeframe : Weekly
Technical
Technical analysis of AUD/CAD in 1H shows a strongly overall bullish trend. The signals given by moving averages are 82.14% bullish. This strongly bullish trend seems to be running out of steam given the signals being given by short-term moving averages. The Central Indicators scanner detects bullish signals on moving averages that could impact this trend:
Bullish price crossover with Moving Average 20
Type : Bullish
Timeframe : 1 hour
Bullish price crossover with Moving Average 100
Type : Bullish
Timeframe : 1 hour
Bullish price crossover with adaptative moving average 50
Type : Bullish
Timeframe : 1 hour
Technical indicators are slightly bullish. There is therefore considerable uncertainty about the continuation of the increase.
Central Indicators, the detector scanner for these technical indicators has recently detected several signals:
RSI indicator is back over 50
Type : Bullish
Timeframe : 1 hour
Price is back over the pivot point
Type : Bullish
Timeframe : 1 hour
Williams %R indicator is back over -50
Type : Bullish
Timeframe : 1 hour
An analysis of the price chart with the Central Patterns scanner (detector of chart patterns and resistances and supports) shows several results that can have an impact on the price change:
Near resistance of triangle
Type : Bearish
Timeframe : 1 hour
Near support of channel
Type : Bullish
Timeframe : 1 hour
The Central Candlesticks scanner which studies Japanese candlesticks did not detect anything.
| S3 | S2 | S1 | R1 | Price | R2 | R3 | |
|---|---|---|---|---|---|---|---|
| ProTrendLines | 0.8976 | 0.8997 | 0.9017 | 0.9047 | 0.9047 | 0.9077 | 0.9191 |
| Change (%) | -0.78% | -0.55% | -0.33% | 0% | - | +0.33% | +1.59% |
| Change | -0.0071 | -0.0050 | -0.0030 | 0 | - | +0.0030 | +0.0144 |
| Level | Minor | Intermediate | Major | Major | - | Minor | Major |
Attention could also be paid to pivot points to set price objectives:
| Pivot points | S3 | S2 | S1 | PP | R1 | R2 | R3 |
|---|---|---|---|---|---|---|---|
| Standard | 0.8987 | 0.9003 | 0.9026 | 0.9042 | 0.9065 | 0.9081 | 0.9104 |
| Camarilla | 0.9039 | 0.9043 | 0.9046 | 0.9050 | 0.9054 | 0.9057 | 0.9061 |
| Woodie | 0.8992 | 0.9005 | 0.9031 | 0.9044 | 0.9070 | 0.9083 | 0.9109 |
| Fibonacci | 0.9003 | 0.9018 | 0.9027 | 0.9042 | 0.9057 | 0.9066 | 0.9081 |
| Pivot points | S3 | S2 | S1 | PP | R1 | R2 | R3 |
|---|---|---|---|---|---|---|---|
| Standard | 0.8803 | 0.8856 | 0.8951 | 0.9004 | 0.9099 | 0.9152 | 0.9247 |
| Camarilla | 0.9005 | 0.9019 | 0.9032 | 0.9046 | 0.9060 | 0.9073 | 0.9087 |
| Woodie | 0.8824 | 0.8867 | 0.8972 | 0.9015 | 0.9120 | 0.9163 | 0.9268 |
| Fibonacci | 0.8856 | 0.8913 | 0.8948 | 0.9004 | 0.9061 | 0.9096 | 0.9152 |
| Pivot points | S3 | S2 | S1 | PP | R1 | R2 | R3 |
|---|---|---|---|---|---|---|---|
| Standard | 0.8575 | 0.8678 | 0.8800 | 0.8903 | 0.9025 | 0.9128 | 0.9250 |
| Camarilla | 0.8859 | 0.8880 | 0.8900 | 0.8921 | 0.8942 | 0.8962 | 0.8983 |
| Woodie | 0.8584 | 0.8683 | 0.8809 | 0.8908 | 0.9034 | 0.9133 | 0.9259 |
| Fibonacci | 0.8678 | 0.8764 | 0.8817 | 0.8903 | 0.8989 | 0.9042 | 0.9128 |
Numerical data
The following is the status of technical indicators and moving averages registered at the time this technical analysis was created:
| RSI (14): | 56.14 | |
| MACD (12,26,9): | 0.0002 | |
| Directional Movement: | 2.3299 | |
| AROON (14): | -35.7143 | |
| DEMA (21): | 0.9046 | |
| Parabolic SAR (0,02-0,02-0,2): | 0.9054 | |
| Elder Ray (13): | 0 | |
| Super Trend (3,10): | 0.9033 | |
| Zig ZAG (10): | 0.9048 | |
| VORTEX (21): | 1.0390 | |
| Stochastique (14,3,5): | 44.93 | |
| TEMA (21): | 0.9046 | |
| Williams %R (14): | -47.83 | |
| Chande Momentum Oscillator (20): | -0.0009 | |
| Repulse (5,40,3): | -0.0026 | |
| ROCnROLL: | 1 | |
| TRIX (15,9): | 0.0043 | |
| Courbe Coppock: | 0.12 |
| MA7: | 0.9037 | |
| MA20: | 0.8942 | |
| MA50: | 0.8910 | |
| MA100: | 0.8895 | |
| MAexp7: | 0.9045 | |
| MAexp20: | 0.9044 | |
| MAexp50: | 0.9041 | |
| MAexp100: | 0.9034 | |
| Price / MA7: | +0.11% | |
| Price / MA20: | +1.17% | |
| Price / MA50: | +1.54% | |
| Price / MA100: | +1.71% | |
| Price / MAexp7: | +0.02% | |
| Price / MAexp20: | +0.03% | |
| Price / MAexp50: | +0.07% | |
| Price / MAexp100: | +0.14% |
News
Don't forget to follow the news on AUD/CAD. At the time of publication of this analysis, the latest news was as follows:
-
 AUD/CAD Forecast January 6, 2023
-
S&P 500 Volatility Should Settle if Risk Appetite is Set, AUDCAD a Top Watch
-
Australian Dollar China GDP Analysis: AUD/USD, AUD/JPY, GBP/AUD, AUD/CAD
-
Australian Dollar Analysis: AUD/USD, AUD/JPY, AUD/CAD Gain as RBA Holds in February
-
AUD/USD, AUD/JPY, AUD/CAD, AUD/NZD Analysis - Australia Jobs Report Coverage
About author

Online


Add a comment
Comments
0 comments on the analysis AUD/CAD - 1H