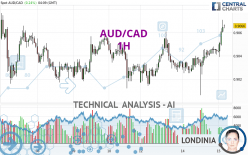
AUD/CAD - 1H - Technical analysis published on 05/15/2024 (GMT)
- 63
- 0
Click here for a new analysis!
- Timeframe : 1H
- - Analysis generated on
- Status : TARGET REACHED

Summary of the analysis

Additional analysis
Quotes
AUD/CAD rating 0.9066 CAD. On the day, this instrument gained +0.24% and was between 0.9039 CAD and 0.9071 CAD. This implies that the price is at +0.30% from its lowest and at -0.06% from its highest.Here is a more detailed summary of the historical variations registered by AUD/CAD:
Near a new HIGH record (1 year)
Type : Bullish
Timeframe : Weekly
Near a new LOW record (1st january)
Type : Bearish
Timeframe : Weekly
Near a new LOW record (1 month)
Type : Bearish
Timeframe : Weekly
Technical
Technical analysis of AUD/CAD in 1H shows a strongly overall bullish trend. 92.86% of the signals given by moving averages are bullish. This strongly bullish trend is supported by the strong bullish signals given by short-term moving averages. There is no crossing of moving average by the price or crossing of moving averages between themselves.
In fact, 15 technical indicators on 18 studied are currently positioned bullish. Caution: the Central Indicators scanner currently detects an excess:
RSI indicator is overbought : over 70
Type : Neutral
Timeframe : 1 hour
CCI indicator is overbought : over 100
Type : Neutral
Timeframe : 1 hour
Previous candle closed over Bollinger bands
Type : Neutral
Timeframe : 1 hour
Williams %R indicator is overbought : over -20
Type : Neutral
Timeframe : 1 hour
Pivot points : price is over resistance 1
Type : Neutral
Timeframe : 1 hour
Pivot points : price is over resistance 1
Type : Neutral
Timeframe : Weekly
An analysis of the price chart with the Central Patterns scanner (detector of chart patterns and resistances and supports) shows several results that can have an impact on the price change:
Near horizontal resistance
Type : Bearish
Timeframe : 1 hour
Resistance of channel is broken
Type : Bullish
Timeframe : 1 hour
The Central Candlesticks scanner, specialised in Japanese candlesticks, did not identify any signals.
| S3 | S2 | S1 | R1 | Price | R2 | R3 | |
|---|---|---|---|---|---|---|---|
| ProTrendLines | 0.9034 | 0.9047 | 0.9057 | 0.9066 | 0.9066 | 0.9077 | 0.9191 |
| Change (%) | -0.35% | -0.21% | -0.10% | 0% | - | +0.12% | +1.38% |
| Change | -0.0032 | -0.0019 | -0.0009 | 0 | - | +0.0011 | +0.0125 |
| Level | Intermediate | Major | Major | Minor | - | Minor | Major |
Attention could also be paid to pivot points to set price objectives:
| Pivot points | S3 | S2 | S1 | PP | R1 | R2 | R3 |
|---|---|---|---|---|---|---|---|
| Standard | 0.8975 | 0.8991 | 0.9017 | 0.9033 | 0.9059 | 0.9075 | 0.9101 |
| Camarilla | 0.9033 | 0.9036 | 0.9040 | 0.9044 | 0.9048 | 0.9052 | 0.9056 |
| Woodie | 0.8981 | 0.8994 | 0.9023 | 0.9036 | 0.9065 | 0.9078 | 0.9107 |
| Fibonacci | 0.8991 | 0.9007 | 0.9017 | 0.9033 | 0.9049 | 0.9059 | 0.9075 |
| Pivot points | S3 | S2 | S1 | PP | R1 | R2 | R3 |
|---|---|---|---|---|---|---|---|
| Standard | 0.8935 | 0.8974 | 0.9000 | 0.9039 | 0.9065 | 0.9104 | 0.9130 |
| Camarilla | 0.9009 | 0.9015 | 0.9021 | 0.9027 | 0.9033 | 0.9039 | 0.9045 |
| Woodie | 0.8930 | 0.8971 | 0.8995 | 0.9036 | 0.9060 | 0.9101 | 0.9125 |
| Fibonacci | 0.8974 | 0.8999 | 0.9014 | 0.9039 | 0.9064 | 0.9079 | 0.9104 |
| Pivot points | S3 | S2 | S1 | PP | R1 | R2 | R3 |
|---|---|---|---|---|---|---|---|
| Standard | 0.8575 | 0.8678 | 0.8800 | 0.8903 | 0.9025 | 0.9128 | 0.9250 |
| Camarilla | 0.8859 | 0.8880 | 0.8900 | 0.8921 | 0.8942 | 0.8962 | 0.8983 |
| Woodie | 0.8584 | 0.8683 | 0.8809 | 0.8908 | 0.9034 | 0.9133 | 0.9259 |
| Fibonacci | 0.8678 | 0.8764 | 0.8817 | 0.8903 | 0.8989 | 0.9042 | 0.9128 |
Numerical data
The following are the details of the technical indicators and moving averages that were collected to generate this technical analysis:
| RSI (14): | 75.68 | |
| MACD (12,26,9): | 0.0007 | |
| Directional Movement: | 11.5967 | |
| AROON (14): | 92.8571 | |
| DEMA (21): | 0.9055 | |
| Parabolic SAR (0,02-0,02-0,2): | 0.9040 | |
| Elder Ray (13): | 0.0015 | |
| Super Trend (3,10): | 0.9042 | |
| Zig ZAG (10): | 0.9065 | |
| VORTEX (21): | 1.1989 | |
| Stochastique (14,3,5): | 86.66 | |
| TEMA (21): | 0.9060 | |
| Williams %R (14): | -17.14 | |
| Chande Momentum Oscillator (20): | 0.0022 | |
| Repulse (5,40,3): | 0.0954 | |
| ROCnROLL: | 1 | |
| TRIX (15,9): | 0.0064 | |
| Courbe Coppock: | 0.40 |
| MA7: | 0.9043 | |
| MA20: | 0.8968 | |
| MA50: | 0.8922 | |
| MA100: | 0.8895 | |
| MAexp7: | 0.9056 | |
| MAexp20: | 0.9047 | |
| MAexp50: | 0.9041 | |
| MAexp100: | 0.9036 | |
| Price / MA7: | +0.25% | |
| Price / MA20: | +1.09% | |
| Price / MA50: | +1.61% | |
| Price / MA100: | +1.92% | |
| Price / MAexp7: | +0.11% | |
| Price / MAexp20: | +0.21% | |
| Price / MAexp50: | +0.28% | |
| Price / MAexp100: | +0.33% |
News
The last news published on AUD/CAD at the time of the generation of this analysis was as follows:
-
 AUD/CAD Forecast January 6, 2023
-
S&P 500 Volatility Should Settle if Risk Appetite is Set, AUDCAD a Top Watch
-
Australian Dollar China GDP Analysis: AUD/USD, AUD/JPY, GBP/AUD, AUD/CAD
-
Australian Dollar Analysis: AUD/USD, AUD/JPY, AUD/CAD Gain as RBA Holds in February
-
AUD/USD, AUD/JPY, AUD/CAD, AUD/NZD Analysis - Australia Jobs Report Coverage
About author

Online


Add a comment
Comments
0 comments on the analysis AUD/CAD - 1H