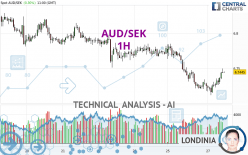
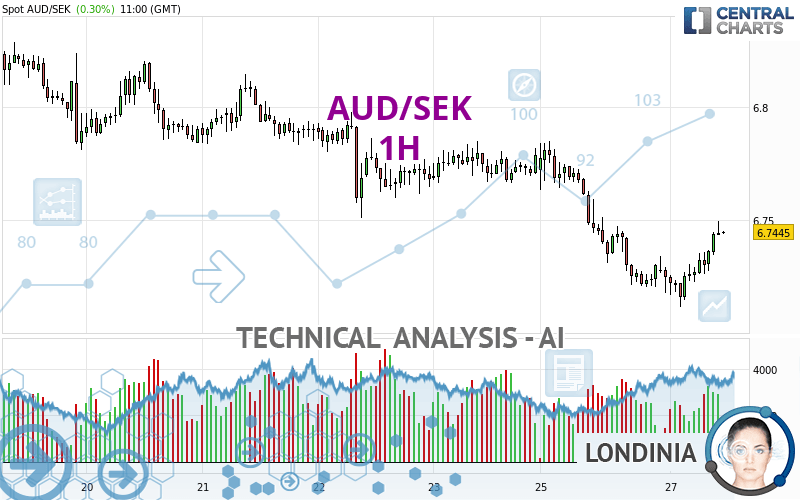
AUD/SEK - 1H - Technical analysis published on 02/27/2024 (GMT)
- 101
- 0
Click here for a new analysis!
- Timeframe : 1H
- - Analysis generated on
- Status : LEVEL MAINTAINED
Summary of the analysis

Additional analysis
Quotes
The AUD/SEK rating is 6.7440 SEK. The price registered an increase of +0.29% on the session and was between 6.7114 SEK and 6.7493 SEK. This implies that the price is at +0.49% from its lowest and at -0.08% from its highest.So that you have an overall view of the price change, here is a table showing the variations over several periods:
New LOW record (1 year)
Type : Bearish
Timeframe : Weekly
Near a new HIGH record (1st january)
Type : Bullish
Timeframe : Weekly
New LOW record (1st january)
Type : Bearish
Timeframe : Weekly
Near a new HIGH record (1 month)
Type : Bullish
Timeframe : Weekly
New LOW record (1 month)
Type : Bearish
Timeframe : Weekly
Technical
Technical analysis of this 1H chart of AUD/SEK indicates that the overall trend is bearish. The signals given by moving averages are 64.29% bearish. This bearish trend could slow down given the neutral signals currently being given by short-term moving averages. An assessment of moving averages reveals a bullish signal that could impact this trend:
Bullish price crossover with adaptative moving average 50
Type : Bullish
Timeframe : 1 hour
In fact, 13 technical indicators on 18 studied are currently bullish. Caution: the Central Indicators scanner currently detects an excess:
CCI indicator is overbought : over 100
Type : Neutral
Timeframe : 1 hour
Previous candle closed over Bollinger bands
Type : Neutral
Timeframe : 1 hour
Williams %R indicator is overbought : over -20
Type : Neutral
Timeframe : 1 hour
Price is back over the pivot point
Type : Bullish
Timeframe : 1 hour
Central Patterns, the market scanner focusing on chart patterns, resistances and supports found these results:
Near horizontal resistance
Type : Bearish
Timeframe : 1 hour
Resistance of channel is broken
Type : Bullish
Timeframe : 1 hour
For a small rebound in the very short term, the Central Candlesticks scanner currently notes the presence of this bullish pattern in Japanese candlesticks:
Three white soldiers
Type : Bullish
Timeframe : 1 hour
| S3 | S2 | S1 | Price | R1 | R2 | R3 | |
|---|---|---|---|---|---|---|---|
| ProTrendLines | 6.4755 | 6.6632 | 6.7204 | 6.7440 | 6.7510 | 6.7849 | 6.7998 |
| Change (%) | -3.98% | -1.20% | -0.35% | - | +0.10% | +0.61% | +0.83% |
| Change | -0.2685 | -0.0808 | -0.0236 | - | +0.0070 | +0.0409 | +0.0558 |
| Level | Minor | Intermediate | Intermediate | - | Minor | Intermediate | Minor |
Pivot points can also be used to set your price objectives. Here is the price situation in relation to pivot points:
| Pivot points | S3 | S2 | S1 | PP | R1 | R2 | R3 |
|---|---|---|---|---|---|---|---|
| Standard | 6.6324 | 6.6749 | 6.6998 | 6.7423 | 6.7672 | 6.8097 | 6.8346 |
| Camarilla | 6.7061 | 6.7122 | 6.7184 | 6.7246 | 6.7308 | 6.7370 | 6.7431 |
| Woodie | 6.6235 | 6.6705 | 6.6909 | 6.7379 | 6.7583 | 6.8053 | 6.8257 |
| Fibonacci | 6.6749 | 6.7007 | 6.7166 | 6.7423 | 6.7681 | 6.7840 | 6.8097 |
| Pivot points | S3 | S2 | S1 | PP | R1 | R2 | R3 |
|---|---|---|---|---|---|---|---|
| Standard | 6.6541 | 6.7026 | 6.7406 | 6.7891 | 6.8271 | 6.8756 | 6.9136 |
| Camarilla | 6.7549 | 6.7628 | 6.7708 | 6.7787 | 6.7866 | 6.7946 | 6.8025 |
| Woodie | 6.6490 | 6.7000 | 6.7355 | 6.7865 | 6.8220 | 6.8730 | 6.9085 |
| Fibonacci | 6.7026 | 6.7356 | 6.7560 | 6.7891 | 6.8221 | 6.8425 | 6.8756 |
| Pivot points | S3 | S2 | S1 | PP | R1 | R2 | R3 |
|---|---|---|---|---|---|---|---|
| Standard | 6.6607 | 6.7386 | 6.7830 | 6.8609 | 6.9053 | 6.9832 | 7.0276 |
| Camarilla | 6.7938 | 6.8050 | 6.8162 | 6.8274 | 6.8386 | 6.8498 | 6.8610 |
| Woodie | 6.6440 | 6.7302 | 6.7663 | 6.8525 | 6.8886 | 6.9748 | 7.0109 |
| Fibonacci | 6.7386 | 6.7853 | 6.8142 | 6.8609 | 6.9076 | 6.9365 | 6.9832 |
Numerical data
The following is the status of the technical indicators and moving averages at the time of publication of this technical analysis:
| RSI (14): | 59.80 | |
| MACD (12,26,9): | -0.0026 | |
| Directional Movement: | 6.2180 | |
| AROON (14): | 57.1429 | |
| DEMA (21): | 6.7284 | |
| Parabolic SAR (0,02-0,02-0,2): | 6.7191 | |
| Elder Ray (13): | 0.0128 | |
| Super Trend (3,10): | 6.7197 | |
| Zig ZAG (10): | 6.7469 | |
| VORTEX (21): | 1.0191 | |
| Stochastique (14,3,5): | 95.57 | |
| TEMA (21): | 6.7336 | |
| Williams %R (14): | -6.86 | |
| Chande Momentum Oscillator (20): | 0.0198 | |
| Repulse (5,40,3): | 0.2360 | |
| ROCnROLL: | -1 | |
| TRIX (15,9): | -0.0155 | |
| Courbe Coppock: | 0.25 |
| MA7: | 6.7699 | |
| MA20: | 6.8086 | |
| MA50: | 6.8431 | |
| MA100: | 6.8939 | |
| MAexp7: | 6.7369 | |
| MAexp20: | 6.7342 | |
| MAexp50: | 6.7459 | |
| MAexp100: | 6.7614 | |
| Price / MA7: | -0.38% | |
| Price / MA20: | -0.95% | |
| Price / MA50: | -1.45% | |
| Price / MA100: | -2.17% | |
| Price / MAexp7: | +0.11% | |
| Price / MAexp20: | +0.15% | |
| Price / MAexp50: | -0.03% | |
| Price / MAexp100: | -0.26% |
About author
Online


Add a comment
Comments
0 comments on the analysis AUD/SEK - 1H