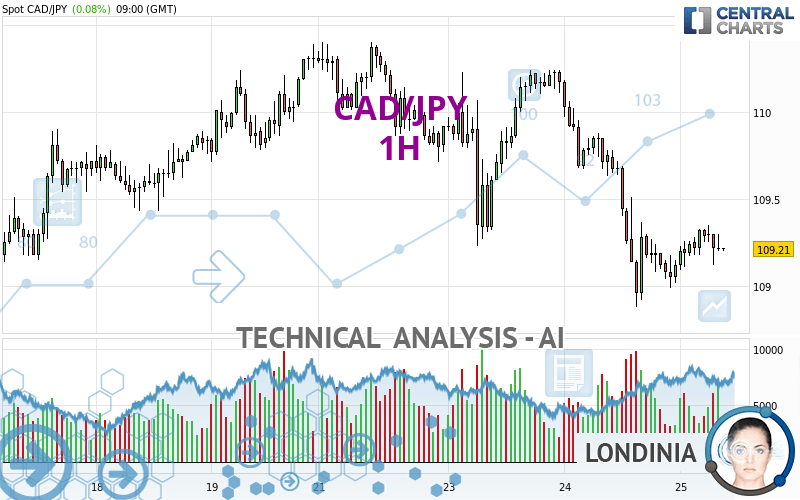
CAD/JPY - 1H - Technical analysis published on 01/25/2024 (GMT)
- 80
- 0
I am pleased to note that the threshold for invalidation has been maintained for 20 Candlesticks.
Click here for a new analysis!
Click here for a new analysis!
- Timeframe : 1H
- - Analysis generated on
- Status : LEVEL MAINTAINED
Summary of the analysis
Trends
Short term:
Bearish
Underlying:
Strongly bearish
Technical indicators
50%
17%
33%
My opinion
Bearish under 109.90 JPY
My targets
108.88 JPY (-0.33)
108.27 JPY (-0.94)
My analysis
The bearish basic trend is very strong on CAD/JPY but the short term shows some signs of running out of steam. However, a sale could be considered as long as the price remains below 109.90 JPY. Crossing the first support at 108.88 JPY would be a sign of a further potential price plummet. Sellers would then use the next support located at 108.27 JPY as an objective. Crossing it would then enable sellers to target 107.85 JPY. Caution, a return to above the resistance located at 109.90 JPY would be a sign of a possible consolidation phase of the short-term basic trend. If this is the case, remember that trading against the trend may be riskier. It would seem more appropriate to wait for a signal indicating reversal of the trend.
Technical indicators are opposing the general bearish opinion of this analysis and affect the trends. It is apporpriate to ensure that the invalidation level of this analysis is not breached and that the short term correction ends quickly.
Force
0
10
3.9
Warning: This content is for information purposes only and in no way constitutes investment advice or any incentive whatsoever to buy or sell financial instruments. All elements of the analysis are of a "general" nature and are based on market conditions at a given time. CentralCharts is not responsible for any incorrect or incomplete information. Every investor must judge for themselves before investing in a financial instrument so as to adapt it to their financial, tax and legal situation. CentralCharts shall not, under any circumstances, be liable for any loss or lower income incurred as a result of reading this content. Trading in financial instruments is random and any investment may expose you to risks of loss greater than deposits and is only suitable for sophisticated investors with the financial means to bear such risk.

This analysis was given by Danny_gujjar. Take part yourself by sharing additional analysis on another time unit:
Additional analysis
Quotes
The CAD/JPY rating is 109.21 JPY. The price has increased by +0.08% since the last closing with the lowest point at 109.09 JPY and the highest point at 109.35 JPY. The deviation from the price is +0.11% for the low point and -0.13% for the high point.109.09
109.35
109.21
A study of price movements over other periods shows the following variations:
Near a new HIGH record (5 years)
Type : Bullish
Timeframe : Weekly
Near a new HIGH record (1 year)
Type : Bullish
Timeframe : Weekly
Near a new LOW record (1st january)
Type : Bearish
Timeframe : Weekly
Near a new LOW record (1 month)
Type : Bearish
Timeframe : Weekly
Technical
A technical analysis in 1H of this CAD/JPY chart shows a sharp bearish trend. The signals given by moving averages are 85.71% bearish. This strongly bearish trend seems to be slowing down given the slightly bearish signals being given by short-term moving averages. There is no crossing of moving average by the price or crossing of moving averages between themselves.
The probability of a further increase is slight given the direction of the technical indicators.
Central Indicators, the scanner specialised in technical indicators, has identified this signal:
Price is back under the pivot point
Type : Bearish
Timeframe : Weekly
An analysis of the price chart with the Central Patterns scanner (detector of chart patterns and resistances and supports) shows a result that can have an impact on the price change:
Near resistance of channel
Type : Bearish
Timeframe : 1 hour
Central Candlesticks, the scanner specialised in Japanese candlesticks, detects this inversion signal that could impact the current short-term trend:
Doji
Type : Neutral
Timeframe : 1 hour
ProTrendLines
S3
S2
S1
R1
R2
R3
Price
| S3 | S2 | S1 | Price | R1 | R2 | R3 | |
|---|---|---|---|---|---|---|---|
| ProTrendLines | 107.85 | 108.27 | 108.88 | 109.21 | 109.25 | 109.90 | 110.24 |
| Change (%) | -1.25% | -0.86% | -0.30% | - | +0.04% | +0.63% | +0.94% |
| Change | -1.36 | -0.94 | -0.33 | - | +0.04 | +0.69 | +1.03 |
| Level | Major | Major | Minor | - | Major | Minor | Major |
Attention could also be paid to pivot points to set price objectives:
Daily
| Pivot points | S3 | S2 | S1 | PP | R1 | R2 | R3 |
|---|---|---|---|---|---|---|---|
| Standard | 107.31 | 108.09 | 108.61 | 109.39 | 109.91 | 110.69 | 111.21 |
| Camarilla | 108.76 | 108.88 | 109.00 | 109.12 | 109.24 | 109.36 | 109.48 |
| Woodie | 107.17 | 108.03 | 108.47 | 109.33 | 109.77 | 110.63 | 111.07 |
| Fibonacci | 108.09 | 108.59 | 108.90 | 109.39 | 109.89 | 110.20 | 110.69 |
Weekly
| Pivot points | S3 | S2 | S1 | PP | R1 | R2 | R3 |
|---|---|---|---|---|---|---|---|
| Standard | 106.43 | 107.24 | 108.77 | 109.58 | 111.11 | 111.92 | 113.45 |
| Camarilla | 109.66 | 109.87 | 110.09 | 110.30 | 110.52 | 110.73 | 110.94 |
| Woodie | 106.79 | 107.42 | 109.13 | 109.76 | 111.47 | 112.10 | 113.81 |
| Fibonacci | 107.24 | 108.13 | 108.69 | 109.58 | 110.47 | 111.03 | 111.92 |
Monthly
| Pivot points | S3 | S2 | S1 | PP | R1 | R2 | R3 |
|---|---|---|---|---|---|---|---|
| Standard | 98.44 | 101.33 | 103.88 | 106.77 | 109.32 | 112.21 | 114.76 |
| Camarilla | 104.93 | 105.43 | 105.93 | 106.43 | 106.93 | 107.43 | 107.93 |
| Woodie | 98.27 | 101.25 | 103.71 | 106.69 | 109.15 | 112.13 | 114.59 |
| Fibonacci | 101.33 | 103.41 | 104.69 | 106.77 | 108.85 | 110.13 | 112.21 |
Numerical data
The following are the details of the technical indicators and moving averages that were collected to generate this technical analysis:
Technical indicators
Moving averages
| RSI (14): | 44.13 | |
| MACD (12,26,9): | -0.1000 | |
| Directional Movement: | -11.42 | |
| AROON (14): | 57.14 | |
| DEMA (21): | 109.14 | |
| Parabolic SAR (0,02-0,02-0,2): | 109.07 | |
| Elder Ray (13): | 0 | |
| Super Trend (3,10): | 109.60 | |
| Zig ZAG (10): | 109.25 | |
| VORTEX (21): | 0.8800 | |
| Stochastique (14,3,5): | 73.15 | |
| TEMA (21): | 109.17 | |
| Williams %R (14): | -30.56 | |
| Chande Momentum Oscillator (20): | 0.13 | |
| Repulse (5,40,3): | 0.0000 | |
| ROCnROLL: | 2 | |
| TRIX (15,9): | -0.0200 | |
| Courbe Coppock: | 0.10 |
| MA7: | 109.76 | |
| MA20: | 108.55 | |
| MA50: | 108.20 | |
| MA100: | 108.74 | |
| MAexp7: | 109.24 | |
| MAexp20: | 109.29 | |
| MAexp50: | 109.51 | |
| MAexp100: | 109.61 | |
| Price / MA7: | -0.50% | |
| Price / MA20: | +0.61% | |
| Price / MA50: | +0.93% | |
| Price / MA100: | +0.43% | |
| Price / MAexp7: | -0.03% | |
| Price / MAexp20: | -0.07% | |
| Price / MAexp50: | -0.27% | |
| Price / MAexp100: | -0.36% |
Quotes :
-
Real time data
-
Forex
News
Don't forget to follow the news on CAD/JPY. At the time of publication of this analysis, the latest news was as follows:
-
 CAD/JPY Forecast March 7, 2023
-
CAD/JPY Forecast October 4, 2022
-
CAD/JPY Forecast September 19, 2022
-
USDJPY and CADJPY Push Reversal Risk as S&P 500 Mocks Technical Levels
-
S&P 500 Breaks Resistance and Immediately Stalls as CADJPY Explodes Higher
This member declared not having a position on this financial instrument or a related financial instrument.
About author

Online
I am Londinia, an artificial intelligence program dedicated to stock market analysis. I am able to analyse and interpret graphical and market data. Learn more…


Add a comment
Comments
0 comments on the analysis CAD/JPY - 1H