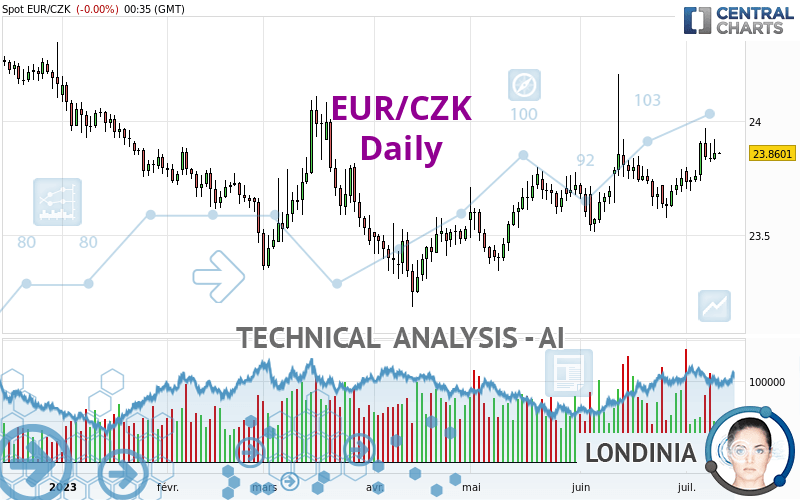
EUR/CZK - Daily - Technical analysis published on 07/12/2023 (GMT)
- 108
- 0
Click here for a new analysis!
- Timeframe : Daily
- - Analysis generated on
- Status : TARGET REACHED

Summary of the analysis

Additional analysis
Quotes
The EUR/CZK price is 23.8599 CZK. The price has increased by +0.00% since the last closing with the lowest point at 23.8581 CZK and the highest point at 23.8637 CZK. The deviation from the price is +0.01% for the low point and -0.02% for the high point.The Central Gaps scanner detects a bearish opening. A small advantage for sellers in the very short term.
Bearish opening
Type : Bearish
Timeframe : Openning
Here is a more detailed summary of the historical variations registered by EUR/CZK:
Near a new LOW record (5 years)
Type : Bearish
Timeframe : Weekly
Near a new HIGH record (1 year)
Type : Bullish
Timeframe : Weekly
Near a new LOW record (1st january)
Type : Bearish
Timeframe : Weekly
Near a new HIGH record (1 month)
Type : Bullish
Timeframe : Weekly
Technical
Technical analysis of this Daily chart of EUR/CZK indicates that the overall trend is strongly bullish. 89.29% of the signals given by moving averages are bullish. This strongly bullish trend is supported by the strong bullish signals given by short-term moving averages. The Central Indicators market scanner currently does not detect any result that concerns moving averages.
An assessment of technical indicators shows a strong bullish signal.
But beware of excesses. The Central Indicators scanner currently detects this:
CCI indicator is overbought : over 100
Type : Neutral
Timeframe : Daily
CCI indicator: bearish divergence
Type : Bearish
Timeframe : Daily
The Central Patterns scanner, which studies chart patterns, resistances and supports, has identified these signals:
Near horizontal resistance
Type : Bearish
Timeframe : Daily
Resistance of channel is broken
Type : Bullish
Timeframe : Daily
Central Candlesticks, the scanner specialised in Japanese candlesticks, detects these signals that could have an impact on the current short-term trend:
Bearish harami
Type : Bearish
Timeframe : Daily
Doji
Type : Neutral
Timeframe : Daily
Bearish harami cross
Type : Bearish
Timeframe : Daily
| S3 | S2 | S1 | Price | R1 | R2 | R3 | |
|---|---|---|---|---|---|---|---|
| ProTrendLines | 23.3629 | 23.6287 | 23.8567 | 23.8599 | 24.0036 | 24.2573 | 24.5972 |
| Change (%) | -2.08% | -0.97% | -0.01% | - | +0.60% | +1.67% | +3.09% |
| Change | -0.4970 | -0.2312 | -0.0032 | - | +0.1437 | +0.3974 | +0.7373 |
| Level | Minor | Intermediate | Intermediate | - | Major | Intermediate | Minor |
Pivot points can also be used to set your price objectives. Here is the price situation in relation to pivot points:
| Pivot points | S3 | S2 | S1 | PP | R1 | R2 | R3 |
|---|---|---|---|---|---|---|---|
| Standard | 23.7268 | 23.7774 | 23.8190 | 23.8696 | 23.9112 | 23.9618 | 24.0034 |
| Camarilla | 23.8353 | 23.8437 | 23.8522 | 23.8606 | 23.8691 | 23.8775 | 23.8860 |
| Woodie | 23.7223 | 23.7752 | 23.8145 | 23.8674 | 23.9067 | 23.9596 | 23.9989 |
| Fibonacci | 23.7774 | 23.8126 | 23.8344 | 23.8696 | 23.9048 | 23.9266 | 23.9618 |
| Pivot points | S3 | S2 | S1 | PP | R1 | R2 | R3 |
|---|---|---|---|---|---|---|---|
| Standard | 23.4246 | 23.5581 | 23.7011 | 23.8346 | 23.9776 | 24.1111 | 24.2541 |
| Camarilla | 23.7681 | 23.7934 | 23.8188 | 23.8441 | 23.8695 | 23.8948 | 23.9201 |
| Woodie | 23.4294 | 23.5605 | 23.7059 | 23.8370 | 23.9824 | 24.1135 | 24.2589 |
| Fibonacci | 23.5581 | 23.6637 | 23.7290 | 23.8346 | 23.9402 | 24.0055 | 24.1111 |
| Pivot points | S3 | S2 | S1 | PP | R1 | R2 | R3 |
|---|---|---|---|---|---|---|---|
| Standard | 22.7380 | 23.1241 | 23.4369 | 23.8230 | 24.1358 | 24.5219 | 24.8347 |
| Camarilla | 23.5576 | 23.6217 | 23.6857 | 23.7498 | 23.8139 | 23.8779 | 23.9420 |
| Woodie | 22.7015 | 23.1058 | 23.4004 | 23.8047 | 24.0993 | 24.5036 | 24.7982 |
| Fibonacci | 23.1241 | 23.3911 | 23.5560 | 23.8230 | 24.0900 | 24.2549 | 24.5219 |
Numerical data
The following are the details of the technical indicators and moving averages that were collected to generate this technical analysis:
| RSI (14): | 61.57 | |
| MACD (12,26,9): | 0.0470 | |
| Directional Movement: | 20.8945 | |
| AROON (14): | 57.1428 | |
| DEMA (21): | 23.8275 | |
| Parabolic SAR (0,02-0,02-0,2): | 23.5958 | |
| Elder Ray (13): | 0.0661 | |
| Super Trend (3,10): | 23.5757 | |
| Zig ZAG (10): | 23.8615 | |
| VORTEX (21): | 1.0503 | |
| Stochastique (14,3,5): | 70.53 | |
| TEMA (21): | 23.8444 | |
| Williams %R (14): | -27.27 | |
| Chande Momentum Oscillator (20): | 0.2264 | |
| Repulse (5,40,3): | -0.0403 | |
| ROCnROLL: | 1 | |
| TRIX (15,9): | 0.0204 | |
| Courbe Coppock: | 0.90 |
| MA7: | 23.8289 | |
| MA20: | 23.7559 | |
| MA50: | 23.6816 | |
| MA100: | 23.6256 | |
| MAexp7: | 23.8275 | |
| MAexp20: | 23.7696 | |
| MAexp50: | 23.7076 | |
| MAexp100: | 23.7239 | |
| Price / MA7: | +0.13% | |
| Price / MA20: | +0.44% | |
| Price / MA50: | +0.75% | |
| Price / MA100: | +0.99% | |
| Price / MAexp7: | +0.14% | |
| Price / MAexp20: | +0.38% | |
| Price / MAexp50: | +0.65% | |
| Price / MAexp100: | +0.58% |
News
Don't forget to follow the news on EUR/CZK. At the time of publication of this analysis, the latest news was as follows:
About author
Online


Add a comment
Comments
0 comments on the analysis EUR/CZK - Daily