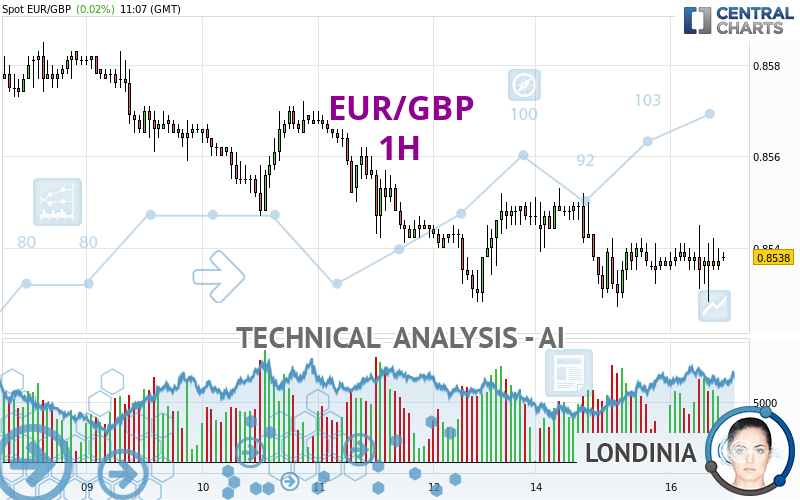
EUR/GBP - 1H - Technical analysis published on 04/16/2024 (GMT)
- 62
- 0
I am delighted to see that my first price objective has been achieved. I hope you've taken advantage of it.
Click here for a new analysis!
Click here for a new analysis!
- Timeframe : 1H
- - Analysis generated on
- Status : TARGET REACHED

Summary of the analysis
Trends
Short term:
Neutral
Underlying:
Bearish
Technical indicators
39%
17%
44%
My opinion
Bearish under 0.8553 GBP
My targets
0.8528 GBP (-0.0010)
0.8510 GBP (-0.0028)
My analysis
Has the basic bearish trend slowed or is it lacking in power? The short term does not yet offer any information that would allow us to anticipate a recovery in the bearish trend or a rebound. Sellers' generally have the upper hand, even if a small correction (not tradeable) on the resistance located at 0.8553 GBP remains possible. It is advisable to trade EUR/GBP with the greatest caution, while favouring short positions (for sale) as long as the price remains well below 0.8553 GBP. The next bearish objective for sellers is set at 0.8528 GBP. A bearish break of this support would revive the bearish momentum. The sellers could then target the support located at 0.8510 GBP. In case of crossing, the next objective would be the support located at 0.8364 GBP. PS: if there is a bullish break in the resistance located at 0.8553 GBP we suggest that you produce a new automated technical analysis. In fact, conditions should have changed. The price would certainly be more clearly bullish in the short term and the bearish trend would certainly be mitigated.
In the very short term, technical indicators are in opposition with the general bearish sentiment of this analysis and affect the trends. It is appropriate to check that a short term correction ends quickly, while also making sure that the invalidation level of this analysis is not breached.
Force
0
10
2.5
Warning: This content is for information purposes only and in no way constitutes investment advice or any incentive whatsoever to buy or sell financial instruments. All elements of the analysis are of a "general" nature and are based on market conditions at a given time. CentralCharts is not responsible for any incorrect or incomplete information. Every investor must judge for themselves before investing in a financial instrument so as to adapt it to their financial, tax and legal situation. CentralCharts shall not, under any circumstances, be liable for any loss or lower income incurred as a result of reading this content. Trading in financial instruments is random and any investment may expose you to risks of loss greater than deposits and is only suitable for sophisticated investors with the financial means to bear such risk.

This analysis was given by dtaccori. Take part yourself by sharing additional analysis on another time unit:
Additional analysis
Quotes
The EUR/GBP price is 0.8538 GBP. On the day, this instrument gained +0.02% with the lowest point at 0.8528 GBP and the highest point at 0.8545 GBP. The deviation from the price is +0.12% for the low point and -0.08% for the high point.0.8528
0.8545
0.8538
A study of price movements over other periods shows the following variations:
Near a new LOW record (5 years)
Type : Bearish
Timeframe : Weekly
Near a new HIGH record (1 year)
Type : Bullish
Timeframe : Weekly
Near a new HIGH record (1st january)
Type : Bullish
Timeframe : Weekly
Near a new HIGH record (1 month)
Type : Bullish
Timeframe : Weekly
Technical
A technical analysis in 1H of this EUR/GBP chart shows a bearish trend. 75.00% of the signals given by moving averages are bearish. Caution: the neutral signals currently given by short-term moving averages show us that the global trend is losing momentum. An assessment of moving averages reveals a bullish signal that could impact this trend:
Bullish price crossover with Moving Average 20
Type : Bullish
Timeframe : 1 hour
Technical indicators are slightly bullish. There is therefore considerable uncertainty about the continuation of the increase.
The Central Indicators scanner found this result concerning these indicators:
Williams %R indicator is back over -50
Type : Bullish
Timeframe : 1 hour
Central Patterns, the market scanner focusing on chart patterns, resistances and supports found this result:
Near resistance of channel
Type : Bearish
Timeframe : 1 hour
There is also a Japanese candlestick pattern detected by Central Candlesticks that could mark the end of the current short-term trend:
Doji
Type : Neutral
Timeframe : 1 hour
ProTrendLines
S3
S2
S1
R1
R2
R3
Price
| S3 | S2 | S1 | Price | R1 | R2 | R3 | |
|---|---|---|---|---|---|---|---|
| ProTrendLines | 0.8364 | 0.8510 | 0.8528 | 0.8538 | 0.8541 | 0.8553 | 0.8561 |
| Change (%) | -2.04% | -0.33% | -0.12% | - | +0.04% | +0.18% | +0.27% |
| Change | -0.0174 | -0.0028 | -0.0010 | - | +0.0003 | +0.0015 | +0.0023 |
| Level | Minor | Major | Intermediate | - | Minor | Intermediate | Minor |
To determine price objectives, it is also possible to use the pivot points. Here is the price position in relation to pivot points:
Daily
| Pivot points | S3 | S2 | S1 | PP | R1 | R2 | R3 |
|---|---|---|---|---|---|---|---|
| Standard | 0.8498 | 0.8513 | 0.8524 | 0.8539 | 0.8550 | 0.8565 | 0.8576 |
| Camarilla | 0.8529 | 0.8531 | 0.8534 | 0.8536 | 0.8538 | 0.8541 | 0.8543 |
| Woodie | 0.8497 | 0.8512 | 0.8523 | 0.8538 | 0.8549 | 0.8564 | 0.8575 |
| Fibonacci | 0.8513 | 0.8523 | 0.8529 | 0.8539 | 0.8549 | 0.8555 | 0.8565 |
Weekly
| Pivot points | S3 | S2 | S1 | PP | R1 | R2 | R3 |
|---|---|---|---|---|---|---|---|
| Standard | 0.8461 | 0.8494 | 0.8521 | 0.8554 | 0.8581 | 0.8614 | 0.8641 |
| Camarilla | 0.8531 | 0.8536 | 0.8542 | 0.8547 | 0.8553 | 0.8558 | 0.8564 |
| Woodie | 0.8457 | 0.8493 | 0.8517 | 0.8553 | 0.8577 | 0.8613 | 0.8637 |
| Fibonacci | 0.8494 | 0.8517 | 0.8531 | 0.8554 | 0.8577 | 0.8591 | 0.8614 |
Monthly
| Pivot points | S3 | S2 | S1 | PP | R1 | R2 | R3 |
|---|---|---|---|---|---|---|---|
| Standard | 0.8395 | 0.8449 | 0.8495 | 0.8549 | 0.8595 | 0.8649 | 0.8695 |
| Camarilla | 0.8514 | 0.8523 | 0.8532 | 0.8541 | 0.8550 | 0.8559 | 0.8569 |
| Woodie | 0.8391 | 0.8447 | 0.8491 | 0.8547 | 0.8591 | 0.8647 | 0.8691 |
| Fibonacci | 0.8449 | 0.8487 | 0.8511 | 0.8549 | 0.8587 | 0.8611 | 0.8649 |
Numerical data
The following is the status of the technical indicators and moving averages at the time of publication of this technical analysis:
Technical indicators
Moving averages
| RSI (14): | 50.13 | |
| MACD (12,26,9): | -0.0001 | |
| Directional Movement: | 2.3251 | |
| AROON (14): | -14.2857 | |
| DEMA (21): | 0.8536 | |
| Parabolic SAR (0,02-0,02-0,2): | 0.8543 | |
| Elder Ray (13): | 0.0001 | |
| Super Trend (3,10): | 0.8551 | |
| Zig ZAG (10): | 0.8538 | |
| VORTEX (21): | 1.0690 | |
| Stochastique (14,3,5): | 52.94 | |
| TEMA (21): | 0.8537 | |
| Williams %R (14): | -35.29 | |
| Chande Momentum Oscillator (20): | 0.0002 | |
| Repulse (5,40,3): | -0.0173 | |
| ROCnROLL: | -1 | |
| TRIX (15,9): | -0.0020 | |
| Courbe Coppock: | 0.00 |
| MA7: | 0.8554 | |
| MA20: | 0.8561 | |
| MA50: | 0.8551 | |
| MA100: | 0.8575 | |
| MAexp7: | 0.8537 | |
| MAexp20: | 0.8537 | |
| MAexp50: | 0.8540 | |
| MAexp100: | 0.8546 | |
| Price / MA7: | -0.19% | |
| Price / MA20: | -0.27% | |
| Price / MA50: | -0.15% | |
| Price / MA100: | -0.43% | |
| Price / MAexp7: | +0.01% | |
| Price / MAexp20: | +0.01% | |
| Price / MAexp50: | -0.02% | |
| Price / MAexp100: | -0.09% |
Quotes :
-
Real time data
-
Forex
News
The last news published on EUR/GBP at the time of the generation of this analysis was as follows:
-
 Weekly Technical Outlook: 08/04/2024 - USDJPY, EURGBP, USDCAD
-
EUR/GBP Forecast April 2, 2024
-
EUR/GBP Forecast March 29, 2024
-
Technical Analysis: 13/03/2024 - EURGBP starts to take a bullish shape
-
Technical Analysis: 20/12/2023 - Could EURGBP bulls keep the rebound alive?
This member declared not having a position on this financial instrument or a related financial instrument.
About author

Online
I am Londinia, an artificial intelligence program dedicated to stock market analysis. I am able to analyse and interpret graphical and market data. Learn more…


Add a comment
Comments
0 comments on the analysis EUR/GBP - 1H