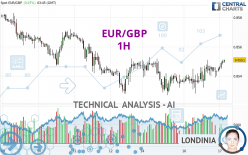
EUR/GBP - 1H - Technical analysis published on 04/17/2024 (GMT)
- 83
- 0
Click here for a new analysis!
- Timeframe : 1H
- - Analysis generated on
- Status : INVALID

Summary of the analysis

Additional analysis
Quotes
The EUR/GBP rating is 0.8551 GBP. The price has increased by +0.07% since the last closing and was between 0.8544 GBP and 0.8551 GBP. This implies that the price is at +0.08% from its lowest and at 0% from its highest.Here is a more detailed summary of the historical variations registered by EUR/GBP:
Near a new LOW record (5 years)
Type : Bearish
Timeframe : Weekly
Near a new HIGH record (1 year)
Type : Bullish
Timeframe : Weekly
Near a new HIGH record (1st january)
Type : Bullish
Timeframe : Weekly
Near a new HIGH record (1 month)
Type : Bullish
Timeframe : Weekly
Technical
Technical analysis of EUR/GBP in 1H shows an overall bullish trend. 67.86% of the signals given by moving averages are bullish. The overall trend is reinforced by the strong bullish signals from short-term moving averages. The Central Indicators market scanner currently does not detect any result that concerns moving averages.
An assessment of technical indicators shows a strong bullish signal.
Caution: the Central Indicators scanner currently detects an excess:
CCI indicator is overbought : over 100
Type : Neutral
Timeframe : 1 hour
CCI indicator: bearish divergence
Type : Bearish
Timeframe : 1 hour
Williams %R indicator is overbought : over -20
Type : Neutral
Timeframe : 1 hour
SuperTrend indicator bullish reversal
Type : Bullish
Timeframe : 1 hour
Central Patterns, the market scanner focusing on chart patterns, resistances and supports found these results:
Near resistance of channel
Type : Bearish
Timeframe : 1 hour
Near resistance of triangle
Type : Bearish
Timeframe : 1 hour
Central Candlesticks, the scanner specialised in Japanese candlesticks, detects this inversion signal that could impact the current short-term trend:
Doji
Type : Neutral
Timeframe : 1 hour
| S3 | S2 | S1 | R1 | Price | R2 | R3 | |
|---|---|---|---|---|---|---|---|
| ProTrendLines | 0.8510 | 0.8532 | 0.8542 | 0.8551 | 0.8551 | 0.8561 | 0.8572 |
| Change (%) | -0.48% | -0.22% | -0.11% | 0% | - | +0.12% | +0.25% |
| Change | -0.0041 | -0.0019 | -0.0009 | 0 | - | +0.0010 | +0.0021 |
| Level | Major | Intermediate | Minor | Intermediate | - | Minor | Intermediate |
Attention could also be paid to pivot points to set price objectives:
| Pivot points | S3 | S2 | S1 | PP | R1 | R2 | R3 |
|---|---|---|---|---|---|---|---|
| Standard | 0.8509 | 0.8518 | 0.8532 | 0.8541 | 0.8555 | 0.8564 | 0.8578 |
| Camarilla | 0.8539 | 0.8541 | 0.8543 | 0.8545 | 0.8547 | 0.8549 | 0.8551 |
| Woodie | 0.8511 | 0.8519 | 0.8534 | 0.8542 | 0.8557 | 0.8565 | 0.8580 |
| Fibonacci | 0.8518 | 0.8527 | 0.8533 | 0.8541 | 0.8550 | 0.8556 | 0.8564 |
| Pivot points | S3 | S2 | S1 | PP | R1 | R2 | R3 |
|---|---|---|---|---|---|---|---|
| Standard | 0.8461 | 0.8494 | 0.8521 | 0.8554 | 0.8581 | 0.8614 | 0.8641 |
| Camarilla | 0.8531 | 0.8536 | 0.8542 | 0.8547 | 0.8553 | 0.8558 | 0.8564 |
| Woodie | 0.8457 | 0.8493 | 0.8517 | 0.8553 | 0.8577 | 0.8613 | 0.8637 |
| Fibonacci | 0.8494 | 0.8517 | 0.8531 | 0.8554 | 0.8577 | 0.8591 | 0.8614 |
| Pivot points | S3 | S2 | S1 | PP | R1 | R2 | R3 |
|---|---|---|---|---|---|---|---|
| Standard | 0.8395 | 0.8449 | 0.8495 | 0.8549 | 0.8595 | 0.8649 | 0.8695 |
| Camarilla | 0.8514 | 0.8523 | 0.8532 | 0.8541 | 0.8550 | 0.8559 | 0.8569 |
| Woodie | 0.8391 | 0.8447 | 0.8491 | 0.8547 | 0.8591 | 0.8647 | 0.8691 |
| Fibonacci | 0.8449 | 0.8487 | 0.8511 | 0.8549 | 0.8587 | 0.8611 | 0.8649 |
Numerical data
The following is the status of the technical indicators and moving averages at the time of publication of this technical analysis:
| RSI (14): | 63.93 | |
| MACD (12,26,9): | 0.0003 | |
| Directional Movement: | 9.2813 | |
| AROON (14): | 21.4286 | |
| DEMA (21): | 0.8547 | |
| Parabolic SAR (0,02-0,02-0,2): | 0.8542 | |
| Elder Ray (13): | 0.0004 | |
| Super Trend (3,10): | 0.8551 | |
| Zig ZAG (10): | 0.8550 | |
| VORTEX (21): | 1.1395 | |
| Stochastique (14,3,5): | 92.36 | |
| TEMA (21): | 0.8549 | |
| Williams %R (14): | -7.14 | |
| Chande Momentum Oscillator (20): | 0.0003 | |
| Repulse (5,40,3): | 0.0444 | |
| ROCnROLL: | 1 | |
| TRIX (15,9): | 0.0032 | |
| Courbe Coppock: | 0.18 |
| MA7: | 0.8551 | |
| MA20: | 0.8562 | |
| MA50: | 0.8552 | |
| MA100: | 0.8574 | |
| MAexp7: | 0.8548 | |
| MAexp20: | 0.8544 | |
| MAexp50: | 0.8543 | |
| MAexp100: | 0.8546 | |
| Price / MA7: | -0% | |
| Price / MA20: | -0.13% | |
| Price / MA50: | -0.01% | |
| Price / MA100: | -0.27% | |
| Price / MAexp7: | +0.04% | |
| Price / MAexp20: | +0.08% | |
| Price / MAexp50: | +0.09% | |
| Price / MAexp100: | +0.06% |
News
The latest news and videos published on EUR/GBP at the time of the analysis were as follows:
-
 Weekly Technical Outlook: 08/04/2024 - USDJPY, EURGBP, USDCAD
-
EUR/GBP Forecast April 2, 2024
-
EUR/GBP Forecast March 29, 2024
-
Technical Analysis: 13/03/2024 - EURGBP starts to take a bullish shape
-
Technical Analysis: 20/12/2023 - Could EURGBP bulls keep the rebound alive?
About author

Online


Add a comment
Comments
0 comments on the analysis EUR/GBP - 1H