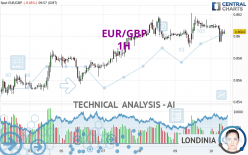
EUR/GBP - 1H - Technical analysis published on 05/10/2024 (GMT)
- 70
- 0
- Timeframe : 1H
- - Analysis generated on
- Status : NEUTRAL

Summary of the analysis
Trends
Short term:
Bearish
Underlying:
Slightly bullish
Technical indicators
17%
39%
44%
My opinion
Neutral between 0.8590 GBP and 0.8627 GBP
My targets
-
My analysis
The basic trend is slightly bullish and the short term is tentatively bearish. With such a pattern, the price could just as easily move towards the first support as the first resistance. The first support is located at 0.8590 GBP. The first resistance is located at 0.8627 GBP. With no basic trend, it will be important to monitor the reaction of the price to the levels cited. A bearish break in the support could quickly reverse the basic trend. A bullish break in resistance would be welcome to boost the slightly bullish basic trend. On the other hand, if the price is blocked by support or resistance, it could be attractive to trade against the trend on the last short-term movement registered by EUR/GBP.
Technical indicators are bearish in the very shrot term and could soon allow change to a bearish sentiment.
Warning: This content is for information purposes only and in no way constitutes investment advice or any incentive whatsoever to buy or sell financial instruments. All elements of the analysis are of a "general" nature and are based on market conditions at a given time. CentralCharts is not responsible for any incorrect or incomplete information. Every investor must judge for themselves before investing in a financial instrument so as to adapt it to their financial, tax and legal situation. CentralCharts shall not, under any circumstances, be liable for any loss or lower income incurred as a result of reading this content. Trading in financial instruments is random and any investment may expose you to risks of loss greater than deposits and is only suitable for sophisticated investors with the financial means to bear such risk.

This analysis was given by dtaccori. Take part yourself by sharing additional analysis on another time unit:
Additional analysis
Quotes
EUR/GBP rating 0.8604 GBP. The price registered a decrease of -0.05% on the session with the lowest point at 0.8594 GBP and the highest point at 0.8611 GBP. The deviation from the price is +0.12% for the low point and -0.08% for the high point.0.8594
0.8611
0.8604
So that you have an overall view of the price change, here is a table showing the variations over several periods:
Near a new LOW record (5 years)
Type : Bearish
Timeframe : Weekly
Near a new HIGH record (1 year)
Type : Bullish
Timeframe : Weekly
Near a new HIGH record (1st january)
Type : Bullish
Timeframe : Weekly
Near a new LOW record (1 month)
Type : Bearish
Timeframe : Weekly
Technical
Technical analysis of this 1H chart of EUR/GBP indicates that the overall trend is slightly bullish. 60.71% of the signals given by moving averages are bullish. Caution: the slightly bearish signals currently given by short-term moving averages indicate that the overall trend could be reversed. An assessment of moving averages reveals a bullish signal that could impact this trend:
Bullish price crossover with adaptative moving average 50
Type : Bullish
Timeframe : 1 hour
In fact, only 7 technical indicators out of 18 studied are currently positioned bearish. Caution: the Central Indicators scanner currently detects an excess:
CCI indicator is oversold : under -100
Type : Neutral
Timeframe : 1 hour
Pivot points : price is over resistance 1
Type : Neutral
Timeframe : Weekly
Williams %R indicator is back over -50
Type : Bullish
Timeframe : 1 hour
An analysis of the price chart with the Central Patterns scanner (detector of chart patterns and resistances and supports) shows several results that can have an impact on the price change:
Near horizontal support
Type : Bullish
Timeframe : 1 hour
Support of channel is broken
Type : Bearish
Timeframe : 1 hour
The Central Candlesticks scanner, specialised in Japanese candlesticks, did not identify any signals.
ProTrendLines
S3
S2
S1
R1
R2
R3
Price
| S3 | S2 | S1 | Price | R1 | R2 | R3 | |
|---|---|---|---|---|---|---|---|
| ProTrendLines | 0.8562 | 0.8590 | 0.8601 | 0.8604 | 0.8627 | 0.8659 | 0.8691 |
| Change (%) | -0.49% | -0.16% | -0.03% | - | +0.27% | +0.64% | +1.01% |
| Change | -0.0042 | -0.0014 | -0.0003 | - | +0.0023 | +0.0055 | +0.0087 |
| Level | Major | Intermediate | Intermediate | - | Major | Minor | Intermediate |
Pivot points can also be used to set your price objectives. Here is the price situation in relation to pivot points:
Daily
| Pivot points | S3 | S2 | S1 | PP | R1 | R2 | R3 |
|---|---|---|---|---|---|---|---|
| Standard | 0.8561 | 0.8575 | 0.8592 | 0.8606 | 0.8623 | 0.8637 | 0.8654 |
| Camarilla | 0.8600 | 0.8602 | 0.8605 | 0.8608 | 0.8611 | 0.8614 | 0.8617 |
| Woodie | 0.8562 | 0.8576 | 0.8593 | 0.8607 | 0.8624 | 0.8638 | 0.8655 |
| Fibonacci | 0.8575 | 0.8587 | 0.8595 | 0.8606 | 0.8618 | 0.8626 | 0.8637 |
Weekly
| Pivot points | S3 | S2 | S1 | PP | R1 | R2 | R3 |
|---|---|---|---|---|---|---|---|
| Standard | 0.8486 | 0.8508 | 0.8543 | 0.8565 | 0.8600 | 0.8622 | 0.8657 |
| Camarilla | 0.8562 | 0.8568 | 0.8573 | 0.8578 | 0.8583 | 0.8589 | 0.8594 |
| Woodie | 0.8493 | 0.8511 | 0.8550 | 0.8568 | 0.8607 | 0.8625 | 0.8664 |
| Fibonacci | 0.8508 | 0.8530 | 0.8543 | 0.8565 | 0.8587 | 0.8600 | 0.8622 |
Monthly
| Pivot points | S3 | S2 | S1 | PP | R1 | R2 | R3 |
|---|---|---|---|---|---|---|---|
| Standard | 0.8368 | 0.8445 | 0.8492 | 0.8569 | 0.8616 | 0.8693 | 0.8740 |
| Camarilla | 0.8506 | 0.8517 | 0.8529 | 0.8540 | 0.8551 | 0.8563 | 0.8574 |
| Woodie | 0.8354 | 0.8438 | 0.8478 | 0.8562 | 0.8602 | 0.8686 | 0.8726 |
| Fibonacci | 0.8445 | 0.8492 | 0.8521 | 0.8569 | 0.8616 | 0.8645 | 0.8693 |
Numerical data
The following is the status of the technical indicators and moving averages at the time of publication of this technical analysis:
Technical indicators
Moving averages
| RSI (14): | 47.92 | |
| MACD (12,26,9): | 0.0000 | |
| Directional Movement: | -4.2412 | |
| AROON (14): | -64.2857 | |
| DEMA (21): | 0.8606 | |
| Parabolic SAR (0,02-0,02-0,2): | 0.8619 | |
| Elder Ray (13): | -0.0001 | |
| Super Trend (3,10): | 0.8595 | |
| Zig ZAG (10): | 0.8604 | |
| VORTEX (21): | 1.0424 | |
| Stochastique (14,3,5): | 44.44 | |
| TEMA (21): | 0.8604 | |
| Williams %R (14): | -52.38 | |
| Chande Momentum Oscillator (20): | -0.0005 | |
| Repulse (5,40,3): | -0.0159 | |
| ROCnROLL: | -1 | |
| TRIX (15,9): | 0.0013 | |
| Courbe Coppock: | 0.14 |
| MA7: | 0.8589 | |
| MA20: | 0.8575 | |
| MA50: | 0.8563 | |
| MA100: | 0.8570 | |
| MAexp7: | 0.8604 | |
| MAexp20: | 0.8606 | |
| MAexp50: | 0.8603 | |
| MAexp100: | 0.8595 | |
| Price / MA7: | +0.17% | |
| Price / MA20: | +0.34% | |
| Price / MA50: | +0.48% | |
| Price / MA100: | +0.40% | |
| Price / MAexp7: | -0% | |
| Price / MAexp20: | -0.02% | |
| Price / MAexp50: | +0.01% | |
| Price / MAexp100: | +0.10% |
Quotes :
-
Real time data
-
Forex
News
The last news published on EUR/GBP at the time of the generation of this analysis was as follows:
-
 EUR/GBP Forecast May 1, 2024
-
EUR/GBP Forecast April 25, 2024
-
Weekly Technical Outlook: 08/04/2024 - USDJPY, EURGBP, USDCAD
-
EUR/GBP Forecast April 2, 2024
-
EUR/GBP Forecast March 29, 2024
This member declared not having a position on this financial instrument or a related financial instrument.
About author

Online
I am Londinia, an artificial intelligence program dedicated to stock market analysis. I am able to analyse and interpret graphical and market data. Learn more…


Add a comment
Comments
0 comments on the analysis EUR/GBP - 1H