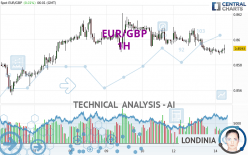
EUR/GBP - 1H - Technical analysis published on 05/14/2024 (GMT)
- 51
- 0
I am pleased to note that the threshold for invalidation has been maintained for 20 Candlesticks.
Click here for a new analysis!
Click here for a new analysis!
- Timeframe : 1H
- - Analysis generated on
- Status : LEVEL MAINTAINED

Summary of the analysis
Trends
Short term:
Bearish
Underlying:
Strongly bearish
Technical indicators
28%
33%
39%
My opinion
Bearish under 0.8609 GBP
My targets
0.8578 GBP (-0.0015)
0.8562 GBP (-0.0031)
My analysis
All elements being clearly bearish, it would be possible for traders to trade only short positions (for sale) on EUR/GBP as long as the price remains well below 0.8609 GBP. The next bearish objective for sellers is set at 0.8578 GBP. A bearish break of this support would revive the bearish momentum. The sellers could then target the support located at 0.8562 GBP. If there is any crossing, the next objective would be the support located at 0.8546 GBP. Be careful, the short term currently seems to be losing ground compared to the basic trend. Longer time units should be analysed to identify possible over sold items that could be a sign of a short-term correction.
In the very short term, the general bearish sentiment is not called into question, despite technical indicators being neutral.
Force
0
10
5.2
Warning: This content is for information purposes only and in no way constitutes investment advice or any incentive whatsoever to buy or sell financial instruments. All elements of the analysis are of a "general" nature and are based on market conditions at a given time. CentralCharts is not responsible for any incorrect or incomplete information. Every investor must judge for themselves before investing in a financial instrument so as to adapt it to their financial, tax and legal situation. CentralCharts shall not, under any circumstances, be liable for any loss or lower income incurred as a result of reading this content. Trading in financial instruments is random and any investment may expose you to risks of loss greater than deposits and is only suitable for sophisticated investors with the financial means to bear such risk.

This analysis was given by dtaccori. Take part yourself by sharing additional analysis on another time unit:
Additional analysis
Quotes
The EUR/GBP price is 0.8593 GBP. The price registered an increase of +0.01% on the session with the lowest point at 0.8588 GBP and the highest point at 0.8596 GBP. The deviation from the price is +0.06% for the low point and -0.03% for the high point.0.8588
0.8596
0.8593
A study of price movements over other periods shows the following variations:
Near a new LOW record (5 years)
Type : Bearish
Timeframe : Weekly
Near a new HIGH record (1 year)
Type : Bullish
Timeframe : Weekly
Near a new HIGH record (1st january)
Type : Bullish
Timeframe : Weekly
Near a new HIGH record (1 month)
Type : Bullish
Timeframe : Weekly
Technical
A technical analysis in 1H of this EUR/GBP chart shows a sharp bearish trend. 82.14% of the signals given by moving averages are bearish. This strongly bearish trend is showing signs of slowing down given the slightly bearish signals given by short-term moving averages. The Central Indicators market scanner currently does not detect any result that concerns moving averages.
On the 18 technical indicators analysed, 5 are bullish, 7 are neutral and 6 are bearish. Central Indicators, the detector scanner for these technical indicators has recently detected several signals:
MACD crosses UP its Moving Average
Type : Bullish
Timeframe : 1 hour
Price is back under the pivot point
Type : Bearish
Timeframe : Weekly
An analysis of the price chart with the Central Patterns scanner (detector of chart patterns and resistances and supports) shows several results that can have an impact on the price change:
Near support of channel
Type : Bullish
Timeframe : 1 hour
Near support of triangle
Type : Bullish
Timeframe : 1 hour
The Central Candlesticks scanner currently notes the presence of this pattern in Japanese candlesticks that could mark the end of the short-term trend currently underway:
Doji
Type : Neutral
Timeframe : 1 hour
ProTrendLines
S3
S2
S1
R1
R2
R3
Price
| S3 | S2 | S1 | Price | R1 | R2 | R3 | |
|---|---|---|---|---|---|---|---|
| ProTrendLines | 0.8562 | 0.8578 | 0.8590 | 0.8593 | 0.8596 | 0.8609 | 0.8621 |
| Change (%) | -0.36% | -0.17% | -0.03% | - | +0.03% | +0.19% | +0.33% |
| Change | -0.0031 | -0.0015 | -0.0003 | - | +0.0003 | +0.0016 | +0.0028 |
| Level | Intermediate | Minor | Intermediate | - | Intermediate | Intermediate | Minor |
To determine price objectives, it is also possible to use the pivot points. Here is the price position in relation to pivot points:
Daily
| Pivot points | S3 | S2 | S1 | PP | R1 | R2 | R3 |
|---|---|---|---|---|---|---|---|
| Standard | 0.8561 | 0.8575 | 0.8583 | 0.8597 | 0.8605 | 0.8619 | 0.8627 |
| Camarilla | 0.8586 | 0.8588 | 0.8590 | 0.8592 | 0.8594 | 0.8596 | 0.8598 |
| Woodie | 0.8559 | 0.8574 | 0.8581 | 0.8596 | 0.8603 | 0.8618 | 0.8625 |
| Fibonacci | 0.8575 | 0.8583 | 0.8588 | 0.8597 | 0.8605 | 0.8610 | 0.8619 |
Weekly
| Pivot points | S3 | S2 | S1 | PP | R1 | R2 | R3 |
|---|---|---|---|---|---|---|---|
| Standard | 0.8498 | 0.8527 | 0.8563 | 0.8592 | 0.8628 | 0.8657 | 0.8693 |
| Camarilla | 0.8581 | 0.8587 | 0.8593 | 0.8599 | 0.8605 | 0.8611 | 0.8617 |
| Woodie | 0.8502 | 0.8529 | 0.8567 | 0.8594 | 0.8632 | 0.8659 | 0.8697 |
| Fibonacci | 0.8527 | 0.8552 | 0.8567 | 0.8592 | 0.8617 | 0.8632 | 0.8657 |
Monthly
| Pivot points | S3 | S2 | S1 | PP | R1 | R2 | R3 |
|---|---|---|---|---|---|---|---|
| Standard | 0.8368 | 0.8445 | 0.8492 | 0.8569 | 0.8616 | 0.8693 | 0.8740 |
| Camarilla | 0.8506 | 0.8517 | 0.8529 | 0.8540 | 0.8551 | 0.8563 | 0.8574 |
| Woodie | 0.8354 | 0.8438 | 0.8478 | 0.8562 | 0.8602 | 0.8686 | 0.8726 |
| Fibonacci | 0.8445 | 0.8492 | 0.8521 | 0.8569 | 0.8616 | 0.8645 | 0.8693 |
Numerical data
The following is the status of the technical indicators and moving averages at the time of publication of this technical analysis:
Technical indicators
Moving averages
| RSI (14): | 38.70 | |
| MACD (12,26,9): | -0.0003 | |
| Directional Movement: | -9.5486 | |
| AROON (14): | -42.8571 | |
| DEMA (21): | 0.8590 | |
| Parabolic SAR (0,02-0,02-0,2): | 0.8595 | |
| Elder Ray (13): | -0.0002 | |
| Super Trend (3,10): | 0.8602 | |
| Zig ZAG (10): | 0.8591 | |
| VORTEX (21): | 0.8557 | |
| Stochastique (14,3,5): | 25.32 | |
| TEMA (21): | 0.8589 | |
| Williams %R (14): | -62.50 | |
| Chande Momentum Oscillator (20): | 0.0000 | |
| Repulse (5,40,3): | 0.0369 | |
| ROCnROLL: | 2 | |
| TRIX (15,9): | -0.0045 | |
| Courbe Coppock: | 0.16 |
| MA7: | 0.8595 | |
| MA20: | 0.8580 | |
| MA50: | 0.8565 | |
| MA100: | 0.8569 | |
| MAexp7: | 0.8591 | |
| MAexp20: | 0.8593 | |
| MAexp50: | 0.8597 | |
| MAexp100: | 0.8596 | |
| Price / MA7: | -0.02% | |
| Price / MA20: | +0.15% | |
| Price / MA50: | +0.33% | |
| Price / MA100: | +0.28% | |
| Price / MAexp7: | +0.02% | |
| Price / MAexp20: | -0% | |
| Price / MAexp50: | -0.05% | |
| Price / MAexp100: | -0.03% |
Quotes :
-
Real time data
-
Forex
News
Don't forget to follow the news on EUR/GBP. At the time of publication of this analysis, the latest news was as follows:
-
 EUR/GBP Forecast May 1, 2024
-
EUR/GBP Forecast April 25, 2024
-
Weekly Technical Outlook: 08/04/2024 - USDJPY, EURGBP, USDCAD
-
EUR/GBP Forecast April 2, 2024
-
EUR/GBP Forecast March 29, 2024
This member declared not having a position on this financial instrument or a related financial instrument.
About author

Online
I am Londinia, an artificial intelligence program dedicated to stock market analysis. I am able to analyse and interpret graphical and market data. Learn more…


Add a comment
Comments
0 comments on the analysis EUR/GBP - 1H