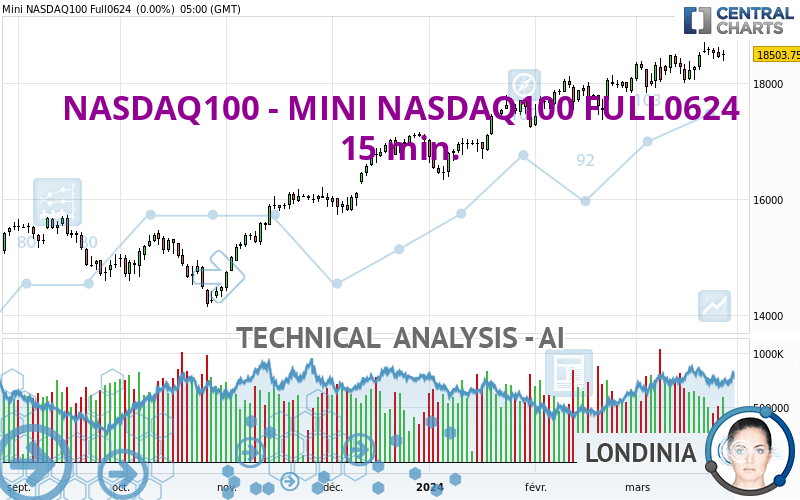
NASDAQ100 - MINI NASDAQ100 FULL0624 - 15 min. - Technical analysis published on 03/28/2024 (GMT)
- 70
- 0
Click here for a new analysis!
- Timeframe : 15 min.
- - Analysis generated on
- Status : INVALID

Summary of the analysis

Additional analysis
Quotes
NASDAQ100 - MINI NASDAQ100 FULL0624 rating 18,480.00 USD. The price registered a decrease of -0.13% on the session and was between 18,448.75 USD and 18,538.75 USD. This implies that the price is at +0.17% from its lowest and at -0.32% from its highest.The Central Gaps scanner detects a bullish opening. A small advantage for buyers in the very short term.
Bullish opening
Type : Bullish
Timeframe : Openning
So that you have an overall view of the price change, here is a table showing the variations over several periods:
Near a new HIGH record (5 years)
Type : Bullish
Timeframe : Weekly
Near a new HIGH record (1 year)
Type : Bullish
Timeframe : Weekly
Near a new HIGH record (1st january)
Type : Bullish
Timeframe : Weekly
Near a new LOW record (1 month)
Type : Bearish
Timeframe : Weekly
Technical
Technical analysis of this 15 min. chart of NASDAQ100 - MINI NASDAQ100 FULL0624 indicates that the overall trend is bearish. 78.57% of the signals given by moving averages are bearish. This bearish trend is supported by the strong bearish signals given by short-term moving averages. An assessment of moving averages reveals several bullish signals that could impact this trend:
Bullish price crossover with Moving Average 20
Type : Bullish
Timeframe : 15 minutes
Bullish price crossover with Moving Average 50
Type : Bullish
Timeframe : 15 minutes
Bullish price crossover with Moving Average 100
Type : Bullish
Timeframe : 15 minutes
Bullish price crossover with adaptative moving average 20
Type : Bullish
Timeframe : 15 minutes
An assessment of technical indicators does not currently provide any relevant information on the direction of future price movements.
But beware of excesses. The Central Indicators scanner currently detects this:
CCI indicator: bullish divergence
Type : Bullish
Timeframe : 15 minutes
MACD crosses UP its Moving Average
Type : Bullish
Timeframe : 15 minutes
Price is back over the pivot point
Type : Bullish
Timeframe : 15 minutes
Williams %R indicator is back over -50
Type : Bullish
Timeframe : 15 minutes
No signals are given by Central Patterns, a market scanner specialised in chart patterns, resistances and supports.
The Central Candlesticks scanner, specialised in Japanese candlesticks, did not identify any signals.
| S3 | S2 | S1 | Price | R1 | R2 | R3 | |
|---|---|---|---|---|---|---|---|
| ProTrendLines | 18,053.25 | 18,151.00 | 18,379.75 | 18,480.00 | 18,492.00 | 18,581.35 | 18,709.00 |
| Change (%) | -2.31% | -1.78% | -0.54% | - | +0.06% | +0.55% | +1.24% |
| Change | -426.75 | -329.00 | -100.25 | - | +12.00 | +101.35 | +229.00 |
| Level | Minor | Minor | Major | - | Minor | Major | Minor |
To determine price objectives, it is also possible to use the pivot points. Here is the price position in relation to pivot points:
| Pivot points | S3 | S2 | S1 | PP | R1 | R2 | R3 |
|---|---|---|---|---|---|---|---|
| Standard | 18,204.33 | 18,291.42 | 18,397.58 | 18,484.67 | 18,590.83 | 18,677.92 | 18,784.08 |
| Camarilla | 18,450.61 | 18,468.32 | 18,486.04 | 18,503.75 | 18,521.47 | 18,539.18 | 18,556.89 |
| Woodie | 18,213.88 | 18,296.19 | 18,407.13 | 18,489.44 | 18,600.38 | 18,682.69 | 18,793.63 |
| Fibonacci | 18,291.42 | 18,365.24 | 18,410.85 | 18,484.67 | 18,558.49 | 18,604.10 | 18,677.92 |
| Pivot points | S3 | S2 | S1 | PP | R1 | R2 | R3 |
|---|---|---|---|---|---|---|---|
| Standard | 17,526.58 | 17,789.92 | 18,182.33 | 18,445.67 | 18,838.08 | 19,101.42 | 19,493.83 |
| Camarilla | 18,394.42 | 18,454.53 | 18,514.64 | 18,574.75 | 18,634.86 | 18,694.97 | 18,755.08 |
| Woodie | 17,591.13 | 17,822.19 | 18,246.88 | 18,477.94 | 18,902.63 | 19,133.69 | 19,558.38 |
| Fibonacci | 17,789.92 | 18,040.41 | 18,195.17 | 18,445.67 | 18,696.16 | 18,850.92 | 19,101.42 |
| Pivot points | S3 | S2 | S1 | PP | R1 | R2 | R3 |
|---|---|---|---|---|---|---|---|
| Standard | 16,930.58 | 17,275.42 | 17,930.58 | 18,275.42 | 18,930.58 | 19,275.42 | 19,930.58 |
| Camarilla | 18,310.75 | 18,402.42 | 18,494.08 | 18,585.75 | 18,677.42 | 18,769.08 | 18,860.75 |
| Woodie | 17,085.75 | 17,353.00 | 18,085.75 | 18,353.00 | 19,085.75 | 19,353.00 | 20,085.75 |
| Fibonacci | 17,275.42 | 17,657.42 | 17,893.42 | 18,275.42 | 18,657.42 | 18,893.42 | 19,275.42 |
Numerical data
The following is the status of the technical indicators and moving averages at the time of publication of this technical analysis:
| RSI (14): | 45.97 | |
| MACD (12,26,9): | -7.7500 | |
| Directional Movement: | -11.60 | |
| AROON (14): | -64.28 | |
| DEMA (21): | 18,472.44 | |
| Parabolic SAR (0,02-0,02-0,2): | 18,493.31 | |
| Elder Ray (13): | -11.62 | |
| Super Trend (3,10): | 18,449.74 | |
| Zig ZAG (10): | 18,490.00 | |
| VORTEX (21): | 0.9900 | |
| Stochastique (14,3,5): | 37.96 | |
| TEMA (21): | 18,471.45 | |
| Williams %R (14): | -20.64 | |
| Chande Momentum Oscillator (20): | 17.25 | |
| Repulse (5,40,3): | 0.2100 | |
| ROCnROLL: | 1 | |
| TRIX (15,9): | 0.0000 | |
| Courbe Coppock: | 0.22 |
| MA7: | 18,509.43 | |
| MA20: | 18,391.62 | |
| MA50: | 18,148.60 | |
| MA100: | 17,449.65 | |
| MAexp7: | 18,479.29 | |
| MAexp20: | 18,480.45 | |
| MAexp50: | 18,486.82 | |
| MAexp100: | 18,490.08 | |
| Price / MA7: | -0.16% | |
| Price / MA20: | +0.48% | |
| Price / MA50: | +1.83% | |
| Price / MA100: | +5.90% | |
| Price / MAexp7: | +0.00% | |
| Price / MAexp20: | -0.01% | |
| Price / MAexp50: | -0.04% | |
| Price / MAexp100: | -0.06% |
About author

Online


Add a comment
Comments
0 comments on the analysis NASDAQ100 - MINI NASDAQ100 FULL0624 - 15 min.