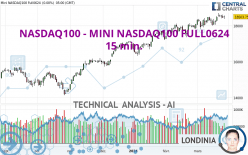
NASDAQ100 - MINI NASDAQ100 FULL0624 - 15 min. - Technical analysis published on 03/28/2024 (GMT)
- 80
- 0
- Timeframe : 15 min.
- - Analysis generated on
- Status : NEUTRAL

Summary of the analysis

Additional analysis
Quotes
The NASDAQ100 - MINI NASDAQ100 FULL0624 price is 18,497.00 USD. The price is lower by -0.04% since the last closing and was between 18,448.75 USD and 18,538.75 USD. This implies that the price is at +0.26% from its lowest and at -0.23% from its highest.The Central Gaps scanner detects a bullish opening marking the presence of buyers ahead of sellers at the opening but not sufficiently marked to allow the price to register a quotation gap.
Bullish opening
Type : Bullish
Timeframe : Openning
Here is a more detailed summary of the historical variations registered by NASDAQ100 - MINI NASDAQ100 FULL0624:
Near a new HIGH record (5 years)
Type : Bullish
Timeframe : Weekly
Near a new HIGH record (1 year)
Type : Bullish
Timeframe : Weekly
Near a new HIGH record (1st january)
Type : Bullish
Timeframe : Weekly
Near a new LOW record (1 month)
Type : Bearish
Timeframe : Weekly
Technical
A technical analysis in 15 min. of this NASDAQ100 - MINI NASDAQ100 FULL0624 chart shows a neutral trend. The slightly bullish signals currently given by short-term moving averages could allow the overall trend to return to a slightly bullish trend. The Central Indicators market scanner is currently detecting several bullish signals that could impact this trend:
Bullish price crossover with Moving Average 20
Type : Bullish
Timeframe : 15 minutes
Bullish price crossover with Moving Average 50
Type : Bullish
Timeframe : 15 minutes
Bullish price crossover with Moving Average 100
Type : Bullish
Timeframe : 15 minutes
Bullish price crossover with adaptative moving average 20
Type : Bullish
Timeframe : 15 minutes
The technical indicators are generally neutral. They do not provide relevant information on the direction of future price movements.
But beware of excesses. The Central Indicators scanner currently detects this:
CCI indicator: bullish divergence
Type : Bullish
Timeframe : 15 minutes
Williams %R indicator is overbought : over -20
Type : Neutral
Timeframe : 15 minutes
MACD crosses UP its Moving Average
Type : Bullish
Timeframe : 15 minutes
Ichimoku : price is under the cloud
Type : Bearish
Timeframe : 15 minutes
Price is back over the pivot point
Type : Bullish
Timeframe : 15 minutes
Momentum indicator is back over 0
Type : Bullish
Timeframe : 15 minutes
Central Patterns, the scanner specializing in chart patterns, did not identify any signals.
The Central Candlesticks scanner, specialised in Japanese candlesticks, did not identify any signals.
| S3 | S2 | S1 | Price | R1 | R2 | |
|---|---|---|---|---|---|---|
| ProTrendLines | 18,151.00 | 18,379.75 | 18,492.00 | 18,497.00 | 18,581.35 | 18,709.00 |
| Change (%) | -1.87% | -0.63% | -0.03% | - | +0.46% | +1.15% |
| Change | -346.00 | -117.25 | -5.00 | - | +84.35 | +212.00 |
| Level | Minor | Major | Minor | - | Major | Minor |
Pivot points can also be used to set your price objectives. Here is the price situation in relation to pivot points:
| Pivot points | S3 | S2 | S1 | PP | R1 | R2 | R3 |
|---|---|---|---|---|---|---|---|
| Standard | 18,204.33 | 18,291.42 | 18,397.58 | 18,484.67 | 18,590.83 | 18,677.92 | 18,784.08 |
| Camarilla | 18,450.61 | 18,468.32 | 18,486.04 | 18,503.75 | 18,521.47 | 18,539.18 | 18,556.89 |
| Woodie | 18,213.88 | 18,296.19 | 18,407.13 | 18,489.44 | 18,600.38 | 18,682.69 | 18,793.63 |
| Fibonacci | 18,291.42 | 18,365.24 | 18,410.85 | 18,484.67 | 18,558.49 | 18,604.10 | 18,677.92 |
| Pivot points | S3 | S2 | S1 | PP | R1 | R2 | R3 |
|---|---|---|---|---|---|---|---|
| Standard | 17,526.58 | 17,789.92 | 18,182.33 | 18,445.67 | 18,838.08 | 19,101.42 | 19,493.83 |
| Camarilla | 18,394.42 | 18,454.53 | 18,514.64 | 18,574.75 | 18,634.86 | 18,694.97 | 18,755.08 |
| Woodie | 17,591.13 | 17,822.19 | 18,246.88 | 18,477.94 | 18,902.63 | 19,133.69 | 19,558.38 |
| Fibonacci | 17,789.92 | 18,040.41 | 18,195.17 | 18,445.67 | 18,696.16 | 18,850.92 | 19,101.42 |
| Pivot points | S3 | S2 | S1 | PP | R1 | R2 | R3 |
|---|---|---|---|---|---|---|---|
| Standard | 16,930.58 | 17,275.42 | 17,930.58 | 18,275.42 | 18,930.58 | 19,275.42 | 19,930.58 |
| Camarilla | 18,310.75 | 18,402.42 | 18,494.08 | 18,585.75 | 18,677.42 | 18,769.08 | 18,860.75 |
| Woodie | 17,085.75 | 17,353.00 | 18,085.75 | 18,353.00 | 19,085.75 | 19,353.00 | 20,085.75 |
| Fibonacci | 17,275.42 | 17,657.42 | 17,893.42 | 18,275.42 | 18,657.42 | 18,893.42 | 19,275.42 |
Numerical data
The following is the status of technical indicators and moving averages registered at the time this technical analysis was created:
| RSI (14): | 46.15 | |
| MACD (12,26,9): | -7.6500 | |
| Directional Movement: | -10.88 | |
| AROON (14): | -64.28 | |
| DEMA (21): | 18,472.70 | |
| Parabolic SAR (0,02-0,02-0,2): | 18,493.31 | |
| Elder Ray (13): | -7.38 | |
| Super Trend (3,10): | 18,449.74 | |
| Zig ZAG (10): | 18,501.25 | |
| VORTEX (21): | 0.9900 | |
| Stochastique (14,3,5): | 51.96 | |
| TEMA (21): | 18,477.93 | |
| Williams %R (14): | -14.95 | |
| Chande Momentum Oscillator (20): | 22.00 | |
| Repulse (5,40,3): | 0.1700 | |
| ROCnROLL: | 1 | |
| TRIX (15,9): | 0.0000 | |
| Courbe Coppock: | 0.23 |
| MA7: | 18,510.68 | |
| MA20: | 18,392.33 | |
| MA50: | 18,148.92 | |
| MA100: | 17,449.83 | |
| MAexp7: | 18,478.66 | |
| MAexp20: | 18,480.40 | |
| MAexp50: | 18,486.80 | |
| MAexp100: | 18,490.09 | |
| Price / MA7: | -0.07% | |
| Price / MA20: | +0.57% | |
| Price / MA50: | +1.92% | |
| Price / MA100: | +6.00% | |
| Price / MAexp7: | +0.10% | |
| Price / MAexp20: | +0.09% | |
| Price / MAexp50: | +0.06% | |
| Price / MAexp100: | +0.04% |
About author

Online


Add a comment
Comments
0 comments on the analysis NASDAQ100 - MINI NASDAQ100 FULL0624 - 15 min.