EUR/JPY - 1H - Technical analysis published on 05/01/2024 (GMT)
- 77
- 0
Click here for a new analysis!
- Timeframe : 1H
- - Analysis generated on
- Status : INVALID
Summary of the analysis

Additional analysis
Quotes
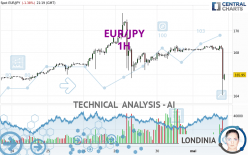
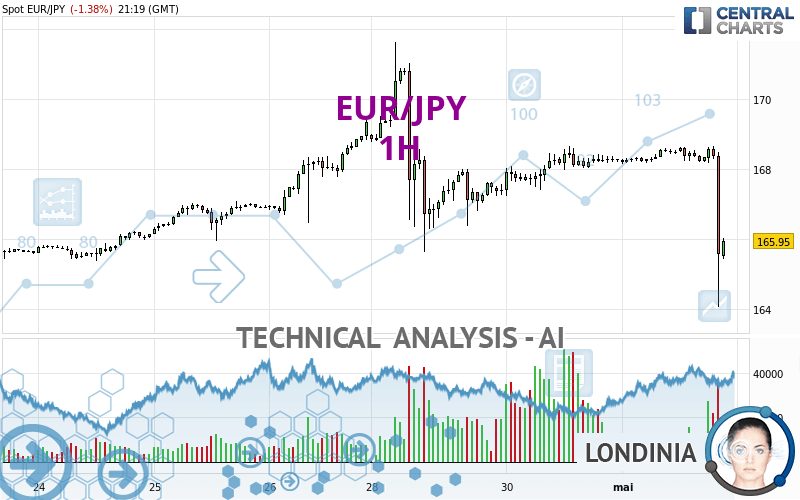
The EUR/JPY price is 165.92 JPY. On the day, this instrument lost -1.40% and was traded between 164.07 JPY and 168.67 JPY over the period. The price is currently at +1.13% from its lowest and -1.63% from its highest.A bearish opening was detected by the Central Gaps scanner. Sellers are trying to impose a bearish trend in the very short term.
Bearish opening
Type : Bearish
Timeframe : Openning
Here is a more detailed summary of the historical variations registered by EUR/JPY:
New HIGH record (5 years)
Type : Bullish
Timeframe : Weekly
Near a new HIGH record (1 year)
Type : Bullish
Timeframe : Weekly
Near a new HIGH record (1st january)
Type : Bullish
Timeframe : Weekly
Near a new HIGH record (1 month)
Type : Bullish
Timeframe : Weekly
Technical
A technical analysis in 1H of this EUR/JPY chart shows a bearish trend. 75.00% of the signals given by moving averages are bearish. The overall trend is reinforced by the strong bearish signals from short-term moving averages. An assessment of moving averages reveals several bearish signals that could impact this trend:
Bearish trend reversal : Moving Average 20
Type : Bearish
Timeframe : 1 hour
Bearish trend reversal : Moving Average 50
Type : Bearish
Timeframe : 1 hour
Bearish trend reversal : Moving Average 100
Type : Bearish
Timeframe : 1 hour
Bearish trend reversal : adaptative moving average 50
Type : Bearish
Timeframe : 1 hour
Bearish trend reversal : adaptative moving average 100
Type : Bearish
Timeframe : 1 hour
An assessment of technical indicators does not currently provide any relevant information to suggest whether the signal given by the technical indicators is more bullish or bearish.
But beware of excesses. The Central Indicators scanner currently detects this:
CCI indicator is oversold : under -100
Type : Neutral
Timeframe : 1 hour
Previous candle closed under Bollinger bands
Type : Neutral
Timeframe : 1 hour
Pivot points : price is under support 1
Type : Neutral
Timeframe : Weekly
Pivot points : price is under support 3
Type : Neutral
Timeframe : 1 hour
No signals are given by Central Patterns, a market scanner specialised in chart patterns, resistances and supports.
No result was found by the Central Candlesticks scanner on Japanese candlesticks.
| S3 | S2 | S1 | Price | R1 | R2 | R3 | |
|---|---|---|---|---|---|---|---|
| ProTrendLines | 163.08 | 164.13 | 165.07 | 165.92 | 167.07 | 168.04 | 169.54 |
| Change (%) | -1.71% | -1.08% | -0.51% | - | +0.69% | +1.28% | +2.18% |
| Change | -2.84 | -1.79 | -0.85 | - | +1.15 | +2.12 | +3.62 |
| Level | Intermediate | Major | Major | - | Minor | Intermediate | Intermediate |
To determine price objectives, it is also possible to use the pivot points. Here is the price position in relation to pivot points:
| Pivot points | S3 | S2 | S1 | PP | R1 | R2 | R3 |
|---|---|---|---|---|---|---|---|
| Standard | 166.01 | 166.61 | 167.45 | 168.05 | 168.89 | 169.49 | 170.33 |
| Camarilla | 167.88 | 168.02 | 168.15 | 168.28 | 168.41 | 168.54 | 168.68 |
| Woodie | 166.12 | 166.67 | 167.56 | 168.11 | 169.00 | 169.55 | 170.44 |
| Fibonacci | 166.61 | 167.16 | 167.50 | 168.05 | 168.60 | 168.94 | 169.49 |
| Pivot points | S3 | S2 | S1 | PP | R1 | R2 | R3 |
|---|---|---|---|---|---|---|---|
| Standard | 161.02 | 162.71 | 166.02 | 167.71 | 171.02 | 172.71 | 176.02 |
| Camarilla | 167.96 | 168.41 | 168.87 | 169.33 | 169.79 | 170.25 | 170.71 |
| Woodie | 161.83 | 163.12 | 166.83 | 168.12 | 171.83 | 173.12 | 176.83 |
| Fibonacci | 162.71 | 164.62 | 165.80 | 167.71 | 169.62 | 170.80 | 172.71 |
| Pivot points | S3 | S2 | S1 | PP | R1 | R2 | R3 |
|---|---|---|---|---|---|---|---|
| Standard | 153.81 | 158.04 | 163.16 | 167.39 | 172.51 | 176.74 | 181.86 |
| Camarilla | 165.71 | 166.57 | 167.42 | 168.28 | 169.14 | 169.99 | 170.85 |
| Woodie | 154.26 | 158.26 | 163.61 | 167.61 | 172.96 | 176.96 | 182.31 |
| Fibonacci | 158.04 | 161.61 | 163.82 | 167.39 | 170.96 | 173.17 | 176.74 |
Numerical data
The following is the status of technical indicators and moving averages registered at the time this technical analysis was created:
| RSI (14): | 19.43 | |
| MACD (12,26,9): | -0.3400 | |
| Directional Movement: | -50.56 | |
| AROON (14): | -7.15 | |
| DEMA (21): | 167.58 | |
| Parabolic SAR (0,02-0,02-0,2): | 168.67 | |
| Elder Ray (13): | -2.06 | |
| Super Trend (3,10): | 167.50 | |
| Zig ZAG (10): | 165.73 | |
| VORTEX (21): | 0.6900 | |
| Stochastique (14,3,5): | 36.00 | |
| TEMA (21): | 167.26 | |
| Williams %R (14): | -57.83 | |
| Chande Momentum Oscillator (20): | -2.53 | |
| Repulse (5,40,3): | -0.6800 | |
| ROCnROLL: | 2 | |
| TRIX (15,9): | 0.0000 | |
| Courbe Coppock: | 1.03 |
| MA7: | 167.09 | |
| MA20: | 165.30 | |
| MA50: | 163.86 | |
| MA100: | 161.49 | |
| MAexp7: | 167.25 | |
| MAexp20: | 167.87 | |
| MAexp50: | 168.00 | |
| MAexp100: | 167.73 | |
| Price / MA7: | -0.70% | |
| Price / MA20: | +0.38% | |
| Price / MA50: | +1.26% | |
| Price / MA100: | +2.74% | |
| Price / MAexp7: | -0.79% | |
| Price / MAexp20: | -1.16% | |
| Price / MAexp50: | -1.23% | |
| Price / MAexp100: | -1.07% |
News
The last news published on EUR/JPY at the time of the generation of this analysis was as follows:
-
 Technical Analysis: 02/04/2024 - EURJPY pulls back towards crucial trendline
-
EUR/JPY Forecast April 1, 2024
-
Technical Analysis: 27/03/2024 - Will EURJPY re-test the 16-year high soon?
-
Technical Analysis: 12/03/2024 - EURJPY drops below ascending channel
-
Technical Analysis: 05/03/2024 - EURJPY recovers from mild pullback
About author

Online


Add a comment
Comments
0 comments on the analysis EUR/JPY - 1H