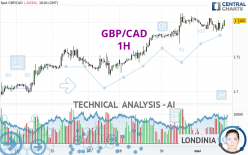
GBP/CAD - 1H - Technical analysis published on 05/01/2024 (GMT)
- 100
- 0
Click here for a new analysis!
- Timeframe : 1H
- - Analysis generated on
- Status : LEVEL MAINTAINED

Summary of the analysis

Additional analysis
Quotes
GBP/CAD rating 1.7204 CAD. The price registered a decrease of -0.02% on the session with the lowest point at 1.7172 CAD and the highest point at 1.7213 CAD. The deviation from the price is +0.19% for the low point and -0.05% for the high point.So that you have an overall view of the price change, here is a table showing the variations over several periods:
Near a new HIGH record (5 years)
Type : Bullish
Timeframe : Weekly
Near a new LOW record (1 year)
Type : Bearish
Timeframe : Weekly
Near a new LOW record (1st january)
Type : Bearish
Timeframe : Weekly
Near a new LOW record (1 month)
Type : Bearish
Timeframe : Weekly
Technical
A technical analysis in 1H of this GBP/CAD chart shows a strongly bullish trend. 89.29% of the signals given by moving averages are bullish. The slightly bullish signals given by the short-term moving averages indicate this trend is showing signs of running out of steam. The Central Indicators scanner detects bullish signals on moving averages that could impact this trend:
Bullish trend reversal : adaptative moving average 20
Type : Bullish
Timeframe : 1 hour
Bullish price crossover with Moving Average 20
Type : Bullish
Timeframe : 1 hour
Bullish price crossover with adaptative moving average 20
Type : Bullish
Timeframe : 1 hour
Bullish price crossover with adaptative moving average 50
Type : Bullish
Timeframe : 1 hour
The technical indicators are bullish. There is still some doubt about the price increase.
Other results related to technical indicators were also found by the Central Indicators scanner:
Pivot points : price is over resistance 1
Type : Neutral
Timeframe : Weekly
Parabolic SAR indicator bullish reversal
Type : Bullish
Timeframe : 1 hour
Price is back over the pivot point
Type : Bullish
Timeframe : 1 hour
An analysis of the price chart with the Central Patterns scanner (detector of chart patterns and resistances and supports) shows several results that can have an impact on the price change:
Near horizontal support
Type : Bullish
Timeframe : 1 hour
Support of channel is broken
Type : Bearish
Timeframe : 1 hour
The Central Candlesticks scanner which studies Japanese candlesticks did not detect anything.
| S3 | S2 | S1 | Price | R1 | R2 | R3 | |
|---|---|---|---|---|---|---|---|
| ProTrendLines | 1.7045 | 1.7139 | 1.7204 | 1.7204 | 1.7329 | 1.7767 | 1.8590 |
| Change (%) | -0.92% | -0.38% | 0% | - | +0.73% | +3.27% | +8.06% |
| Change | -0.0159 | -0.0065 | 0 | - | +0.0125 | +0.0563 | +0.1386 |
| Level | Minor | Intermediate | Major | - | Major | Major | Minor |
Pivot points can also be used to set your price objectives. Here is the price situation in relation to pivot points:
| Pivot points | S3 | S2 | S1 | PP | R1 | R2 | R3 |
|---|---|---|---|---|---|---|---|
| Standard | 1.7067 | 1.7103 | 1.7155 | 1.7191 | 1.7243 | 1.7279 | 1.7331 |
| Camarilla | 1.7183 | 1.7191 | 1.7199 | 1.7207 | 1.7215 | 1.7223 | 1.7231 |
| Woodie | 1.7075 | 1.7107 | 1.7163 | 1.7195 | 1.7251 | 1.7283 | 1.7339 |
| Fibonacci | 1.7103 | 1.7137 | 1.7157 | 1.7191 | 1.7225 | 1.7245 | 1.7279 |
| Pivot points | S3 | S2 | S1 | PP | R1 | R2 | R3 |
|---|---|---|---|---|---|---|---|
| Standard | 1.6690 | 1.6788 | 1.6934 | 1.7032 | 1.7178 | 1.7276 | 1.7422 |
| Camarilla | 1.7012 | 1.7034 | 1.7057 | 1.7079 | 1.7101 | 1.7124 | 1.7146 |
| Woodie | 1.6713 | 1.6800 | 1.6957 | 1.7044 | 1.7201 | 1.7288 | 1.7445 |
| Fibonacci | 1.6788 | 1.6882 | 1.6939 | 1.7032 | 1.7126 | 1.7183 | 1.7276 |
| Pivot points | S3 | S2 | S1 | PP | R1 | R2 | R3 |
|---|---|---|---|---|---|---|---|
| Standard | 1.6628 | 1.6758 | 1.6982 | 1.7112 | 1.7336 | 1.7466 | 1.7690 |
| Camarilla | 1.7110 | 1.7142 | 1.7175 | 1.7207 | 1.7240 | 1.7272 | 1.7304 |
| Woodie | 1.6676 | 1.6782 | 1.7030 | 1.7136 | 1.7384 | 1.7490 | 1.7738 |
| Fibonacci | 1.6758 | 1.6893 | 1.6976 | 1.7112 | 1.7247 | 1.7330 | 1.7466 |
Numerical data
The following are the details of the technical indicators and moving averages that were collected to generate this technical analysis:
| RSI (14): | 53.30 | |
| MACD (12,26,9): | 0.0001 | |
| Directional Movement: | 7.1269 | |
| AROON (14): | -35.7143 | |
| DEMA (21): | 1.7195 | |
| Parabolic SAR (0,02-0,02-0,2): | 1.7172 | |
| Elder Ray (13): | 0.0007 | |
| Super Trend (3,10): | 1.7164 | |
| Zig ZAG (10): | 1.7197 | |
| VORTEX (21): | 0.9663 | |
| Stochastique (14,3,5): | 48.78 | |
| TEMA (21): | 1.7189 | |
| Williams %R (14): | -26.83 | |
| Chande Momentum Oscillator (20): | 0.0021 | |
| Repulse (5,40,3): | 0.1154 | |
| ROCnROLL: | 1 | |
| TRIX (15,9): | 0.0023 | |
| Courbe Coppock: | 0.07 |
| MA7: | 1.7116 | |
| MA20: | 1.7127 | |
| MA50: | 1.7157 | |
| MA100: | 1.7083 | |
| MAexp7: | 1.7190 | |
| MAexp20: | 1.7192 | |
| MAexp50: | 1.7177 | |
| MAexp100: | 1.7149 | |
| Price / MA7: | +0.51% | |
| Price / MA20: | +0.45% | |
| Price / MA50: | +0.27% | |
| Price / MA100: | +0.71% | |
| Price / MAexp7: | +0.09% | |
| Price / MAexp20: | +0.08% | |
| Price / MAexp50: | +0.16% | |
| Price / MAexp100: | +0.33% |
News
Don't forget to follow the news on GBP/CAD. At the time of publication of this analysis, the latest news was as follows:
-
 GBPCAD Sports a Trend That Belies Uncertainty and High Risk of Volatility (Quick Take Video)
-
Webinar: Central Bank Weekly: GBP, CAD Rebound as BOE, BOC Rate Hike Odds Rise: 7/5/18
-
Why I'm looking to buy GBPCAD: Coleman
-
Oil & Brexit GBP CAD
-
Webinar: Price Action Setups GBP, CAD, DXY
About author
Online


Add a comment
Comments
0 comments on the analysis GBP/CAD - 1H