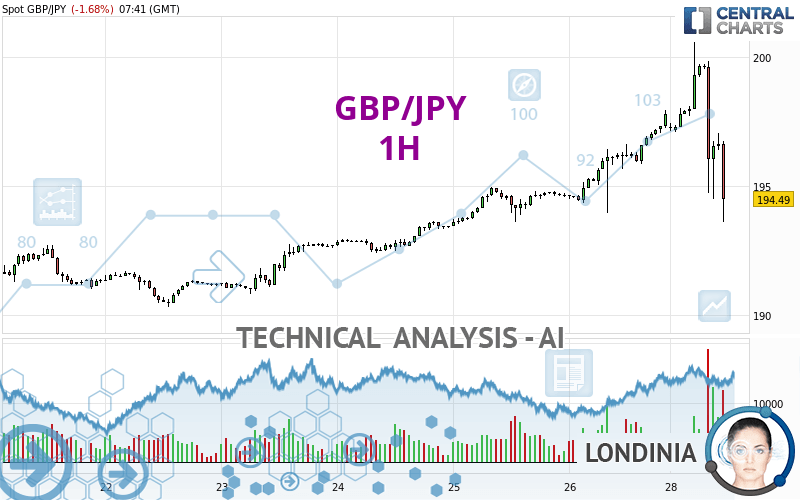
GBP/JPY - 1H - Technical analysis published on 04/29/2024 (GMT)
- 74
- 0
Click here for a new analysis!
- Timeframe : 1H
- - Analysis generated on
- Status : INVALID

Summary of the analysis

Additional analysis
Quotes
The GBP/JPY price is 194.50 JPY. The price registered a decrease of -1.67% on the session with the lowest point at 193.61 JPY and the highest point at 200.58 JPY. The deviation from the price is +0.46% for the low point and -3.03% for the high point.The Central Gaps scanner detects a bearish opening. A small advantage for sellers in the very short term.
Bearish opening
Type : Bearish
Timeframe : Openning
Here is a more detailed summary of the historical variations registered by GBP/JPY:
New HIGH record (5 years)
Type : Bullish
Timeframe : Weekly
New HIGH record (1 year)
Type : Bullish
Timeframe : Weekly
New HIGH record (1st january)
Type : Bullish
Timeframe : Weekly
New HIGH record (1 month)
Type : Bullish
Timeframe : Weekly
Technical
Technical analysis of GBP/JPY in 1H shows an overall slightly bearish trend. 57.14% of the signals given by moving averages are bearish. This slightly bearish trend could be reinforced by the strong bearish signals given by short-term moving averages. The Central Indicators scanner detects bearish signals on moving averages that could impact this trend:
Bearish price crossover with Moving Average 50
Type : Bearish
Timeframe : 1 hour
Bearish price crossover with Moving Average 100
Type : Bearish
Timeframe : 1 hour
Technical indicators are slightly bearish. There is therefore considerable uncertainty about the continuation of the decline.
Caution: the Central Indicators scanner currently detects an excess:
CCI indicator is oversold : under -100
Type : Neutral
Timeframe : 1 hour
Williams %R indicator is oversold : under -80
Type : Neutral
Timeframe : 1 hour
Pivot points : price is under support 1
Type : Neutral
Timeframe : 1 hour
Price is back under the pivot point
Type : Bearish
Timeframe : Weekly
Central Patterns, the scanner specializing in chart patterns, did not identify any signals.
No result was found by the Central Candlesticks scanner on Japanese candlesticks.
| S3 | S2 | S1 | Price | R1 | R2 | R3 | |
|---|---|---|---|---|---|---|---|
| ProTrendLines | 190.76 | 192.82 | 193.97 | 194.50 | 195.83 | 196.63 | 215.53 |
| Change (%) | -1.92% | -0.86% | -0.27% | - | +0.68% | +1.10% | +10.81% |
| Change | -3.74 | -1.68 | -0.53 | - | +1.33 | +2.13 | +21.03 |
| Level | Intermediate | Intermediate | Minor | - | Major | Minor | Minor |
Pivot points can also be used to set your price objectives. Here is the price situation in relation to pivot points:
| Pivot points | S3 | S2 | S1 | PP | R1 | R2 | R3 |
|---|---|---|---|---|---|---|---|
| Standard | 191.24 | 192.60 | 195.21 | 196.57 | 199.18 | 200.54 | 203.15 |
| Camarilla | 196.72 | 197.08 | 197.45 | 197.81 | 198.17 | 198.54 | 198.90 |
| Woodie | 191.86 | 192.91 | 195.83 | 196.88 | 199.80 | 200.85 | 203.77 |
| Fibonacci | 192.60 | 194.12 | 195.06 | 196.57 | 198.09 | 199.03 | 200.54 |
| Pivot points | S3 | S2 | S1 | PP | R1 | R2 | R3 |
|---|---|---|---|---|---|---|---|
| Standard | 185.15 | 187.74 | 192.77 | 195.36 | 200.39 | 202.98 | 208.01 |
| Camarilla | 195.72 | 196.41 | 197.11 | 197.81 | 198.51 | 199.21 | 199.91 |
| Woodie | 186.38 | 188.35 | 194.00 | 195.97 | 201.62 | 203.59 | 209.24 |
| Fibonacci | 187.74 | 190.65 | 192.45 | 195.36 | 198.27 | 200.07 | 202.98 |
| Pivot points | S3 | S2 | S1 | PP | R1 | R2 | R3 |
|---|---|---|---|---|---|---|---|
| Standard | 182.57 | 185.26 | 188.15 | 190.84 | 193.73 | 196.42 | 199.31 |
| Camarilla | 189.50 | 190.01 | 190.52 | 191.03 | 191.54 | 192.05 | 192.57 |
| Woodie | 182.66 | 185.31 | 188.24 | 190.89 | 193.82 | 196.47 | 199.40 |
| Fibonacci | 185.26 | 187.40 | 188.71 | 190.84 | 192.98 | 194.29 | 196.42 |
Numerical data
The following is the status of technical indicators and moving averages registered at the time this technical analysis was created:
| RSI (14): | 34.30 | |
| MACD (12,26,9): | 0.2000 | |
| Directional Movement: | -23.52 | |
| AROON (14): | -42.86 | |
| DEMA (21): | 197.43 | |
| Parabolic SAR (0,02-0,02-0,2): | 200.00 | |
| Elder Ray (13): | -1.55 | |
| Super Trend (3,10): | 199.14 | |
| Zig ZAG (10): | 194.31 | |
| VORTEX (21): | 0.9100 | |
| Stochastique (14,3,5): | 23.50 | |
| TEMA (21): | 197.05 | |
| Williams %R (14): | -98.90 | |
| Chande Momentum Oscillator (20): | -3.65 | |
| Repulse (5,40,3): | -1.8200 | |
| ROCnROLL: | 2 | |
| TRIX (15,9): | 0.0500 | |
| Courbe Coppock: | 0.14 |
| MA7: | 193.54 | |
| MA20: | 192.44 | |
| MA50: | 191.19 | |
| MA100: | 188.12 | |
| MAexp7: | 196.49 | |
| MAexp20: | 196.97 | |
| MAexp50: | 196.03 | |
| MAexp100: | 194.85 | |
| Price / MA7: | +0.50% | |
| Price / MA20: | +1.07% | |
| Price / MA50: | +1.73% | |
| Price / MA100: | +3.39% | |
| Price / MAexp7: | -1.02% | |
| Price / MAexp20: | -1.26% | |
| Price / MAexp50: | -0.79% | |
| Price / MAexp100: | -0.19% |
News
The latest news and videos published on GBP/JPY at the time of the analysis were as follows:
-
 GBP/JPY Forecast April 25, 2024
-
GBP/JPY Forecast April 18, 2024
-
GBP/JPY Forecast April 17, 2024
-
Technical Analysis: 22/03/2024 - GBPJPY plummets from 8½-year high
-
Technical Analysis: 15/03/2024 - GBPJPY ticks up from rising trend line
About author

Online


Add a comment
Comments
0 comments on the analysis GBP/JPY - 1H