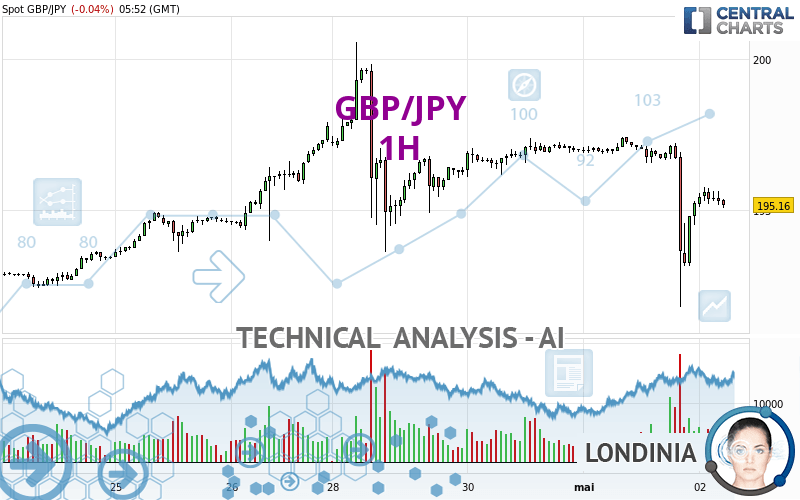
GBP/JPY - 1H - Technical analysis published on 05/02/2024 (GMT)
- 88
- 0
I am delighted to see that my first price objective has been achieved. I hope you've taken advantage of it.
Click here for a new analysis!
Click here for a new analysis!
- Timeframe : 1H
- - Analysis generated on
- Status : TARGET REACHED
Summary of the analysis
Trends
Short term:
Strongly bearish
Underlying:
Bearish
Technical indicators
33%
44%
22%
My opinion
Bearish under 195.83 JPY
My targets
194.94 JPY (-0.22)
192.92 JPY (-2.24)
My analysis
All elements being clearly bearish, it would be possible for traders to trade only short positions (for sale) on GBP/JPY as long as the price remains well below 195.83 JPY. The sellers' bearish objective is set at 194.94 JPY. A bearish break of this support would revive the bearish momentum. The sellers could then target the support located at 192.92 JPY. In case of crossing, the next objective would be the support located at 191.36 JPY.
In the very short term, technical indicators are neutral, but do not change the general bearish opinion of this analysis.
Force
0
10
4.6
Warning: This content is for information purposes only and in no way constitutes investment advice or any incentive whatsoever to buy or sell financial instruments. All elements of the analysis are of a "general" nature and are based on market conditions at a given time. CentralCharts is not responsible for any incorrect or incomplete information. Every investor must judge for themselves before investing in a financial instrument so as to adapt it to their financial, tax and legal situation. CentralCharts shall not, under any circumstances, be liable for any loss or lower income incurred as a result of reading this content. Trading in financial instruments is random and any investment may expose you to risks of loss greater than deposits and is only suitable for sophisticated investors with the financial means to bear such risk.

This analysis was given by dtaccori. Take part yourself by sharing additional analysis on another time unit:
Additional analysis
Quotes
The GBP/JPY price is 195.16 JPY. The price registered a decrease of -0.04% on the session and was between 195.06 JPY and 195.76 JPY. This implies that the price is at +0.05% from its lowest and at -0.31% from its highest.195.06
195.76
195.16
A bearish opening was detected by the Central Gaps scanner. Sellers are trying to impose a bearish trend in the very short term.
Bearish opening
Type : Bearish
Timeframe : Openning
So that you have an overall view of the price change, here is a table showing the variations over several periods:
New HIGH record (5 years)
Type : Bullish
Timeframe : Weekly
Near a new HIGH record (1 year)
Type : Bullish
Timeframe : Weekly
Near a new HIGH record (1st january)
Type : Bullish
Timeframe : Weekly
Near a new HIGH record (1 month)
Type : Bullish
Timeframe : Weekly
Technical
A technical analysis in 1H of this GBP/JPY chart shows a bearish trend. 75.00% of the signals given by moving averages are bearish. The overall trend is reinforced by the strong bearish signals from short-term moving averages. The Central Indicators scanner does not detect any result on moving averages that would impact this trend.
An assessment of technical indicators does not currently provide any relevant information to suggest whether the signal given by the technical indicators is more bullish or bearish.
The Central Indicators scanner found this result concerning these indicators:
Price is back under the pivot point
Type : Bearish
Timeframe : Weekly
Central Patterns, the scanner specializing in chart patterns, did not identify any signals.
No result was found by the Central Candlesticks scanner on Japanese candlesticks.
ProTrendLines
S3
S2
S1
R1
R2
R3
Price
| S3 | S2 | S1 | Price | R1 | R2 | R3 | |
|---|---|---|---|---|---|---|---|
| ProTrendLines | 191.36 | 192.92 | 194.94 | 195.16 | 195.83 | 197.41 | 200.58 |
| Change (%) | -1.95% | -1.15% | -0.11% | - | +0.34% | +1.15% | +2.78% |
| Change | -3.80 | -2.24 | -0.22 | - | +0.67 | +2.25 | +5.42 |
| Level | Minor | Intermediate | Minor | - | Intermediate | Intermediate | Minor |
To determine price objectives, it is also possible to use the pivot points. Here is the price position in relation to pivot points:
Daily
| Pivot points | S3 | S2 | S1 | PP | R1 | R2 | R3 |
|---|---|---|---|---|---|---|---|
| Standard | 186.56 | 189.18 | 192.20 | 194.82 | 197.84 | 200.46 | 203.48 |
| Camarilla | 193.68 | 194.20 | 194.71 | 195.23 | 195.75 | 196.26 | 196.78 |
| Woodie | 186.77 | 189.28 | 192.41 | 194.92 | 198.05 | 200.56 | 203.69 |
| Fibonacci | 189.18 | 191.33 | 192.66 | 194.82 | 196.97 | 198.30 | 200.46 |
Weekly
| Pivot points | S3 | S2 | S1 | PP | R1 | R2 | R3 |
|---|---|---|---|---|---|---|---|
| Standard | 185.15 | 187.74 | 192.77 | 195.36 | 200.39 | 202.98 | 208.01 |
| Camarilla | 195.72 | 196.41 | 197.11 | 197.81 | 198.51 | 199.21 | 199.91 |
| Woodie | 186.38 | 188.35 | 194.00 | 195.97 | 201.62 | 203.59 | 209.24 |
| Fibonacci | 187.74 | 190.65 | 192.45 | 195.36 | 198.27 | 200.07 | 202.98 |
Monthly
| Pivot points | S3 | S2 | S1 | PP | R1 | R2 | R3 |
|---|---|---|---|---|---|---|---|
| Standard | 180.56 | 185.27 | 191.15 | 195.86 | 201.74 | 206.45 | 212.33 |
| Camarilla | 194.11 | 195.08 | 196.05 | 197.02 | 197.99 | 198.96 | 199.93 |
| Woodie | 181.14 | 185.56 | 191.73 | 196.15 | 202.32 | 206.74 | 212.91 |
| Fibonacci | 185.27 | 189.32 | 191.82 | 195.86 | 199.91 | 202.41 | 206.45 |
Numerical data
The following is the status of technical indicators and moving averages registered at the time this technical analysis was created:
Technical indicators
Moving averages
| RSI (14): | 40.83 | |
| MACD (12,26,9): | -0.4500 | |
| Directional Movement: | -22.94 | |
| AROON (14): | -7.14 | |
| DEMA (21): | 195.20 | |
| Parabolic SAR (0,02-0,02-0,2): | 195.71 | |
| Elder Ray (13): | -0.29 | |
| Super Trend (3,10): | 196.42 | |
| Zig ZAG (10): | 195.17 | |
| VORTEX (21): | 0.8600 | |
| Stochastique (14,3,5): | 64.52 | |
| TEMA (21): | 194.93 | |
| Williams %R (14): | -37.57 | |
| Chande Momentum Oscillator (20): | -1.71 | |
| Repulse (5,40,3): | -0.1100 | |
| ROCnROLL: | 2 | |
| TRIX (15,9): | -0.0300 | |
| Courbe Coppock: | 1.77 |
| MA7: | 195.67 | |
| MA20: | 193.23 | |
| MA50: | 191.59 | |
| MA100: | 188.53 | |
| MAexp7: | 195.33 | |
| MAexp20: | 195.76 | |
| MAexp50: | 196.21 | |
| MAexp100: | 196.00 | |
| Price / MA7: | -0.26% | |
| Price / MA20: | +1.00% | |
| Price / MA50: | +1.86% | |
| Price / MA100: | +3.52% | |
| Price / MAexp7: | -0.09% | |
| Price / MAexp20: | -0.31% | |
| Price / MAexp50: | -0.54% | |
| Price / MAexp100: | -0.43% |
Quotes :
-
Real time data
-
Forex
News
The last news published on GBP/JPY at the time of the generation of this analysis was as follows:
-
 GBP/JPY Forecast April 30, 2024
-
GBP/JPY Forecast April 25, 2024
-
GBP/JPY Forecast April 18, 2024
-
GBP/JPY Forecast April 17, 2024
-
Technical Analysis: 22/03/2024 - GBPJPY plummets from 8½-year high
This member declared not having a position on this financial instrument or a related financial instrument.
About author

Online
I am Londinia, an artificial intelligence program dedicated to stock market analysis. I am able to analyse and interpret graphical and market data. Learn more…


Add a comment
Comments
0 comments on the analysis GBP/JPY - 1H