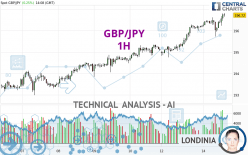
GBP/JPY - 1H - Technical analysis published on 05/14/2024 (GMT)
- 64
- 0
Click here for a new analysis!
- Timeframe : 1H
- - Analysis generated on
- Status : LEVEL MAINTAINED

Summary of the analysis

Additional analysis
Quotes
The GBP/JPY price is 196.72 JPY. The price registered an increase of +0.26% on the session and was between 195.72 JPY and 196.82 JPY. This implies that the price is at +0.51% from its lowest and at -0.05% from its highest.The Central Gaps scanner detects a bullish opening. A small advantage for buyers in the very short term.
Bullish opening
Type : Bullish
Timeframe : Openning
Here is a more detailed summary of the historical variations registered by GBP/JPY:
Near a new HIGH record (5 years)
Type : Bullish
Timeframe : Weekly
Near a new HIGH record (1 year)
Type : Bullish
Timeframe : Weekly
Near a new HIGH record (1st january)
Type : Bullish
Timeframe : Weekly
Near a new LOW record (1 month)
Type : Bearish
Timeframe : Weekly
Technical
Technical analysis of this 1H chart of GBP/JPY indicates that the overall trend is strongly bullish. 92.86% of the signals given by moving averages are bullish. This strongly bullish trend is supported by the strong bullish signals given by short-term moving averages. The Central Indicators scanner does not detect any result on moving averages that would impact this trend.
The probability of a further increase is high given the direction of the technical indicators.
Caution: the Central Indicators scanner currently detects an excess:
CCI indicator is overbought : over 100
Type : Neutral
Timeframe : 1 hour
Williams %R indicator is overbought : over -20
Type : Neutral
Timeframe : 1 hour
Pivot points : price is over resistance 1
Type : Neutral
Timeframe : Weekly
The Central Patterns scanner, which studies chart patterns, resistances and supports, has identified these signals:
Near horizontal resistance
Type : Bearish
Timeframe : 1 hour
Resistance of channel is broken
Type : Bullish
Timeframe : 1 hour
The presence of a bearish pattern in Japanese candlesticks detected by Central Candlesticks that could cause a correction in the very short term was also detected:
Black gravestone / inverted hammer
Type : Bearish
Timeframe : 1 hour
| S3 | S2 | S1 | Price | R1 | R2 | |
|---|---|---|---|---|---|---|
| ProTrendLines | 194.85 | 195.83 | 196.28 | 196.72 | 197.81 | 215.53 |
| Change (%) | -0.95% | -0.45% | -0.22% | - | +0.55% | +9.56% |
| Change | -1.87 | -0.89 | -0.44 | - | +1.09 | +18.81 |
| Level | Intermediate | Minor | Intermediate | - | Intermediate | Intermediate |
To determine price objectives, it is also possible to use the pivot points. Here is the price position in relation to pivot points:
| Pivot points | S3 | S2 | S1 | PP | R1 | R2 | R3 |
|---|---|---|---|---|---|---|---|
| Standard | 193.69 | 194.22 | 195.22 | 195.75 | 196.75 | 197.28 | 198.28 |
| Camarilla | 195.80 | 195.94 | 196.08 | 196.22 | 196.36 | 196.50 | 196.64 |
| Woodie | 193.93 | 194.34 | 195.46 | 195.87 | 196.99 | 197.40 | 198.52 |
| Fibonacci | 194.22 | 194.80 | 195.17 | 195.75 | 196.33 | 196.70 | 197.28 |
| Pivot points | S3 | S2 | S1 | PP | R1 | R2 | R3 |
|---|---|---|---|---|---|---|---|
| Standard | 189.10 | 190.39 | 192.76 | 194.05 | 196.42 | 197.71 | 200.08 |
| Camarilla | 194.11 | 194.45 | 194.79 | 195.12 | 195.46 | 195.79 | 196.13 |
| Woodie | 189.63 | 190.66 | 193.29 | 194.32 | 196.95 | 197.98 | 200.61 |
| Fibonacci | 190.39 | 191.79 | 192.66 | 194.05 | 195.45 | 196.32 | 197.71 |
| Pivot points | S3 | S2 | S1 | PP | R1 | R2 | R3 |
|---|---|---|---|---|---|---|---|
| Standard | 180.56 | 185.27 | 191.15 | 195.86 | 201.74 | 206.45 | 212.33 |
| Camarilla | 194.11 | 195.08 | 196.05 | 197.02 | 197.99 | 198.96 | 199.93 |
| Woodie | 181.14 | 185.56 | 191.73 | 196.15 | 202.32 | 206.74 | 212.91 |
| Fibonacci | 185.27 | 189.32 | 191.82 | 195.86 | 199.91 | 202.41 | 206.45 |
Numerical data
The following is the status of technical indicators and moving averages registered at the time this technical analysis was created:
| RSI (14): | 70.80 | |
| MACD (12,26,9): | 0.2300 | |
| Directional Movement: | 14.14 | |
| AROON (14): | 42.86 | |
| DEMA (21): | 196.63 | |
| Parabolic SAR (0,02-0,02-0,2): | 195.78 | |
| Elder Ray (13): | 0.36 | |
| Super Trend (3,10): | 196.06 | |
| Zig ZAG (10): | 196.77 | |
| VORTEX (21): | 1.1500 | |
| Stochastique (14,3,5): | 92.48 | |
| TEMA (21): | 196.63 | |
| Williams %R (14): | -3.64 | |
| Chande Momentum Oscillator (20): | 0.33 | |
| Repulse (5,40,3): | 0.1600 | |
| ROCnROLL: | 1 | |
| TRIX (15,9): | 0.0200 | |
| Courbe Coppock: | 0.23 |
| MA7: | 194.85 | |
| MA20: | 194.11 | |
| MA50: | 192.16 | |
| MA100: | 189.58 | |
| MAexp7: | 196.52 | |
| MAexp20: | 196.32 | |
| MAexp50: | 195.87 | |
| MAexp100: | 195.38 | |
| Price / MA7: | +0.96% | |
| Price / MA20: | +1.34% | |
| Price / MA50: | +2.37% | |
| Price / MA100: | +3.77% | |
| Price / MAexp7: | +0.10% | |
| Price / MAexp20: | +0.20% | |
| Price / MAexp50: | +0.43% | |
| Price / MAexp100: | +0.69% |
News
The last news published on GBP/JPY at the time of the generation of this analysis was as follows:
-
 Trading the trend: Time to go long GBP/JPY?
-
GBP/JPY Forecast May 3, 2024
-
GBP/JPY Forecast April 30, 2024
-
GBP/JPY Forecast April 25, 2024
-
GBP/JPY Forecast April 18, 2024
About author

Online


Add a comment
Comments
0 comments on the analysis GBP/JPY - 1H