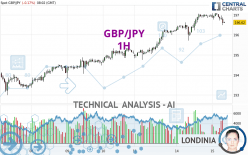
GBP/JPY - 1H - Technical analysis published on 05/15/2024 (GMT)
- 58
- 0
Click here for a new analysis!
- Timeframe : 1H
- - Analysis generated on
- Status : INVALID

Summary of the analysis

Additional analysis
Quotes
The GBP/JPY price is 196.62 JPY. The price registered a decrease of -0.17% on the session and was traded between 196.48 JPY and 197.09 JPY over the period. The price is currently at +0.07% from its lowest and -0.24% from its highest.A bullish opening was detected by the Central Gaps scanner. Buyers are trying to impose a bullish momentum in the very short term.
Bullish opening
Type : Bullish
Timeframe : Openning
Here is a more detailed summary of the historical variations registered by GBP/JPY:
Near a new HIGH record (5 years)
Type : Bullish
Timeframe : Weekly
Near a new HIGH record (1 year)
Type : Bullish
Timeframe : Weekly
Near a new HIGH record (1st january)
Type : Bullish
Timeframe : Weekly
Near a new LOW record (1 month)
Type : Bearish
Timeframe : Weekly
Technical
Technical analysis of GBP/JPY in 1H shows an overall bullish trend. The signals given by moving averages are 75.00% bullish. This bullish trend could slow down given the neutral signals currently being given by short-term moving averages. An assessment of moving averages reveals several bearish signals that could impact this trend:
Bearish trend reversal : adaptative moving average 20
Type : Bearish
Timeframe : 1 hour
Bearish price crossover with adaptative moving average 100
Type : Bearish
Timeframe : 1 hour
Technical indicators are slightly bearish. There is therefore considerable uncertainty about the continuation of the decline.
Caution: the Central Indicators scanner currently detects an excess:
CCI indicator is oversold : under -100
Type : Neutral
Timeframe : 1 hour
Williams %R indicator is oversold : under -80
Type : Neutral
Timeframe : 1 hour
Pivot points : price is over resistance 1
Type : Neutral
Timeframe : Weekly
RSI indicator is back under 50
Type : Bearish
Timeframe : 1 hour
Price is back under the pivot point
Type : Bearish
Timeframe : 1 hour
Central Patterns, the market scanner focusing on chart patterns, resistances and supports found these results:
Near horizontal support
Type : Bullish
Timeframe : 1 hour
Support of channel is broken
Type : Bearish
Timeframe : 1 hour
The Central Candlesticks scanner, specialised in Japanese candlesticks, did not identify any signals.
| S3 | S2 | S1 | Price | R1 | R2 | R3 | |
|---|---|---|---|---|---|---|---|
| ProTrendLines | 192.92 | 194.76 | 195.83 | 196.62 | 197.04 | 197.81 | 215.53 |
| Change (%) | -1.88% | -0.95% | -0.40% | - | +0.21% | +0.61% | +9.62% |
| Change | -3.70 | -1.86 | -0.79 | - | +0.42 | +1.19 | +18.91 |
| Level | Intermediate | Intermediate | Intermediate | - | Intermediate | Intermediate | Intermediate |
To determine price objectives, it is also possible to use the pivot points. Here is the price position in relation to pivot points:
| Pivot points | S3 | S2 | S1 | PP | R1 | R2 | R3 |
|---|---|---|---|---|---|---|---|
| Standard | 194.76 | 195.24 | 196.10 | 196.58 | 197.44 | 197.92 | 198.78 |
| Camarilla | 196.59 | 196.71 | 196.84 | 196.96 | 197.08 | 197.21 | 197.33 |
| Woodie | 194.95 | 195.34 | 196.29 | 196.68 | 197.63 | 198.02 | 198.97 |
| Fibonacci | 195.24 | 195.75 | 196.07 | 196.58 | 197.09 | 197.41 | 197.92 |
| Pivot points | S3 | S2 | S1 | PP | R1 | R2 | R3 |
|---|---|---|---|---|---|---|---|
| Standard | 189.10 | 190.39 | 192.76 | 194.05 | 196.42 | 197.71 | 200.08 |
| Camarilla | 194.11 | 194.45 | 194.79 | 195.12 | 195.46 | 195.79 | 196.13 |
| Woodie | 189.63 | 190.66 | 193.29 | 194.32 | 196.95 | 197.98 | 200.61 |
| Fibonacci | 190.39 | 191.79 | 192.66 | 194.05 | 195.45 | 196.32 | 197.71 |
| Pivot points | S3 | S2 | S1 | PP | R1 | R2 | R3 |
|---|---|---|---|---|---|---|---|
| Standard | 180.56 | 185.27 | 191.15 | 195.86 | 201.74 | 206.45 | 212.33 |
| Camarilla | 194.11 | 195.08 | 196.05 | 197.02 | 197.99 | 198.96 | 199.93 |
| Woodie | 181.14 | 185.56 | 191.73 | 196.15 | 202.32 | 206.74 | 212.91 |
| Fibonacci | 185.27 | 189.32 | 191.82 | 195.86 | 199.91 | 202.41 | 206.45 |
Numerical data
The following is the status of the technical indicators and moving averages at the time of publication of this technical analysis:
| RSI (14): | 43.46 | |
| MACD (12,26,9): | 0.1200 | |
| Directional Movement: | -6.91 | |
| AROON (14): | -35.71 | |
| DEMA (21): | 196.98 | |
| Parabolic SAR (0,02-0,02-0,2): | 197.08 | |
| Elder Ray (13): | -0.16 | |
| Super Trend (3,10): | 196.53 | |
| Zig ZAG (10): | 196.56 | |
| VORTEX (21): | 1.0900 | |
| Stochastique (14,3,5): | 21.87 | |
| TEMA (21): | 196.88 | |
| Williams %R (14): | -81.97 | |
| Chande Momentum Oscillator (20): | -0.40 | |
| Repulse (5,40,3): | -0.1800 | |
| ROCnROLL: | -1 | |
| TRIX (15,9): | 0.0100 | |
| Courbe Coppock: | 0.00 |
| MA7: | 195.31 | |
| MA20: | 194.34 | |
| MA50: | 192.29 | |
| MA100: | 189.73 | |
| MAexp7: | 196.82 | |
| MAexp20: | 196.78 | |
| MAexp50: | 196.38 | |
| MAexp100: | 195.81 | |
| Price / MA7: | +0.67% | |
| Price / MA20: | +1.17% | |
| Price / MA50: | +2.25% | |
| Price / MA100: | +3.63% | |
| Price / MAexp7: | -0.10% | |
| Price / MAexp20: | -0.08% | |
| Price / MAexp50: | +0.12% | |
| Price / MAexp100: | +0.41% |
News
Don't forget to follow the news on GBP/JPY. At the time of publication of this analysis, the latest news was as follows:
-
 Trading the trend: Time to go long GBP/JPY?
-
GBP/JPY Forecast May 3, 2024
-
GBP/JPY Forecast April 30, 2024
-
GBP/JPY Forecast April 25, 2024
-
GBP/JPY Forecast April 18, 2024
About author

Online


Add a comment
Comments
0 comments on the analysis GBP/JPY - 1H