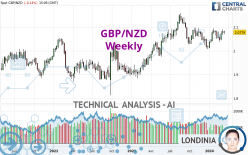
GBP/NZD - Weekly - Technical analysis published on 03/13/2024 (GMT)
- 109
- 0
- Timeframe : Weekly
- - Analysis generated on
- Status : IN PROGRESS...

Summary of the analysis

Additional analysis
Quotes
The GBP/NZD rating is 2.0778 NZD. The price is lower by -0.01% over the 5 days and has been traded over the last 5 days between 2.0700 NZD and 2.0838 NZD. This implies that the 5 day price is +0.38% from its lowest point and -0.29% from its highest point.Here is a more detailed summary of the historical variations registered by GBP/NZD:
Near a new HIGH record (5 years)
Type : Bullish
Timeframe : Weekly
Near a new HIGH record (1 year)
Type : Bullish
Timeframe : Weekly
Near a new LOW record (1st january)
Type : Bearish
Timeframe : Weekly
Near a new LOW record (1 month)
Type : Bearish
Timeframe : Weekly
Technical
Technical analysis of GBP/NZD in Weekly shows a strongly overall bullish trend. 85.71% of the signals given by moving averages are bullish. The slightly bullish signals given by the short-term moving averages show a weakening of the global trend. The Central Indicators scanner detects bearish signals on moving averages that could impact this trend:
Bearish trend reversal : Moving Average 20
Type : Bearish
Timeframe : Weekly
Moving Average bearish crossovers : MA20 & MA50
Type : Bearish
Timeframe : Weekly
The probability of a further increase is high given the direction of the technical indicators.
Caution: the Central Indicators scanner currently detects an excess:
Williams %R indicator is overbought : over -20
Type : Neutral
Timeframe : Weekly
Ichimoku - Bullish crossover : Tenkan & Kijun
Type : Bullish
Timeframe : Weekly
Price is back under the pivot point
Type : Bearish
Timeframe : Weekly
An analysis of the price chart with the Central Patterns scanner (detector of chart patterns and resistances and supports) shows a result that can have an impact on the price change:
Near resistance of channel
Type : Bearish
Timeframe : Weekly
For a small setback in the very short term, the Central Candlesticks scanner currently notes the presence of this bearish pattern in Japanese candlesticks:
Bearish harami
Type : Bearish
Timeframe : Weekly
| S3 | S2 | S1 | Price | R1 | R2 | R3 | |
|---|---|---|---|---|---|---|---|
| ProTrendLines | 1.9189 | 2.0096 | 2.0517 | 2.0778 | 2.0949 | 2.1521 | 2.2327 |
| Change (%) | -7.65% | -3.28% | -1.26% | - | +0.82% | +3.58% | +7.46% |
| Change | -0.1589 | -0.0682 | -0.0261 | - | +0.0171 | +0.0743 | +0.1549 |
| Level | Minor | Major | Intermediate | - | Major | Major | Minor |
Attention could also be paid to pivot points to set price objectives:
| Pivot points | S3 | S2 | S1 | PP | R1 | R2 | R3 |
|---|---|---|---|---|---|---|---|
| Standard | 2.0621 | 2.0661 | 2.0734 | 2.0774 | 2.0847 | 2.0887 | 2.0960 |
| Camarilla | 2.0777 | 2.0787 | 2.0798 | 2.0808 | 2.0818 | 2.0829 | 2.0839 |
| Woodie | 2.0639 | 2.0669 | 2.0752 | 2.0782 | 2.0865 | 2.0895 | 2.0978 |
| Fibonacci | 2.0661 | 2.0704 | 2.0731 | 2.0774 | 2.0817 | 2.0844 | 2.0887 |
| Pivot points | S3 | S2 | S1 | PP | R1 | R2 | R3 |
|---|---|---|---|---|---|---|---|
| Standard | 2.0434 | 2.0549 | 2.0684 | 2.0799 | 2.0934 | 2.1049 | 2.1184 |
| Camarilla | 2.0749 | 2.0772 | 2.0795 | 2.0818 | 2.0841 | 2.0864 | 2.0887 |
| Woodie | 2.0443 | 2.0554 | 2.0693 | 2.0804 | 2.0943 | 2.1054 | 2.1193 |
| Fibonacci | 2.0549 | 2.0645 | 2.0704 | 2.0799 | 2.0895 | 2.0954 | 2.1049 |
| Pivot points | S3 | S2 | S1 | PP | R1 | R2 | R3 |
|---|---|---|---|---|---|---|---|
| Standard | 1.9981 | 2.0178 | 2.0460 | 2.0657 | 2.0939 | 2.1136 | 2.1418 |
| Camarilla | 2.0611 | 2.0655 | 2.0699 | 2.0743 | 2.0787 | 2.0831 | 2.0875 |
| Woodie | 2.0025 | 2.0199 | 2.0504 | 2.0678 | 2.0983 | 2.1157 | 2.1462 |
| Fibonacci | 2.0178 | 2.0361 | 2.0474 | 2.0657 | 2.0840 | 2.0953 | 2.1136 |
Numerical data
The following are the details of the technical indicators and moving averages that were collected to generate this technical analysis:
| RSI (14): | 54.85 | |
| MACD (12,26,9): | 0.0041 | |
| Directional Movement: | 6.5596 | |
| AROON (14): | 28.5714 | |
| DEMA (21): | 2.0685 | |
| Parabolic SAR (0,02-0,02-0,2): | 2.0289 | |
| Elder Ray (13): | 0.0119 | |
| Super Trend (3,10): | 2.1106 | |
| Zig ZAG (10): | 2.0785 | |
| VORTEX (21): | 1.0340 | |
| Stochastique (14,3,5): | 80.75 | |
| TEMA (21): | 2.0636 | |
| Williams %R (14): | -18.20 | |
| Chande Momentum Oscillator (20): | 0.0617 | |
| Repulse (5,40,3): | 0.5474 | |
| ROCnROLL: | 1 | |
| TRIX (15,9): | 0.0044 | |
| Courbe Coppock: | 1.45 |
| MA7: | 2.0795 | |
| MA20: | 2.0662 | |
| MA50: | 2.0654 | |
| MA100: | 2.0610 | |
| MAexp7: | 2.0688 | |
| MAexp20: | 2.0634 | |
| MAexp50: | 2.0466 | |
| MAexp100: | 2.0185 | |
| Price / MA7: | -0.08% | |
| Price / MA20: | +0.56% | |
| Price / MA50: | +0.60% | |
| Price / MA100: | +0.82% | |
| Price / MAexp7: | +0.44% | |
| Price / MAexp20: | +0.70% | |
| Price / MAexp50: | +1.52% | |
| Price / MAexp100: | +2.94% |
News
The latest news and videos published on GBP/NZD at the time of the analysis were as follows:
-
 Why I'm looking to buy GBPNZD: Coleman
-
Why I'm looking to buy GBPNZD: Coleman
-
GBP/NZD: Pound Has Upperhand
-
Forex Trading Video: GBP/NZD The Cross Roads of BoE and RBNZ, Dollar Faces Wave of Data
-
Forex Strategy Video: Time Frame Matters on Entry from Themes Like Risk Trends to GBPNZD
About author

Online


Add a comment
Comments
0 comments on the analysis GBP/NZD - Weekly