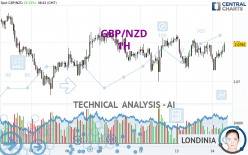
GBP/NZD - 1H - Technical analysis published on 03/14/2024 (GMT)
- 103
- 0
Click here for a new analysis!
- Timeframe : 1H
- - Analysis generated on
- Status : TARGET REACHED

Summary of the analysis

Additional analysis
Quotes
The GBP/NZD rating is 2.0794 NZD. The price registered an increase of +0.14% on the session with the lowest point at 2.0727 NZD and the highest point at 2.0800 NZD. The deviation from the price is +0.32% for the low point and -0.03% for the high point.A study of price movements over other periods shows the following variations:
Near a new HIGH record (5 years)
Type : Bullish
Timeframe : Weekly
Near a new HIGH record (1 year)
Type : Bullish
Timeframe : Weekly
Near a new LOW record (1st january)
Type : Bearish
Timeframe : Weekly
Near a new LOW record (1 month)
Type : Bearish
Timeframe : Weekly
Technical
A technical analysis in 1H of this GBP/NZD chart shows a bullish trend. 67.86% of the signals given by moving averages are bullish. This bullish trend shows slight signs of slowing down given the slightly bullish signals given by the short-term moving averages. An assessment of moving averages reveals several bullish signals that could impact this trend:
Bullish trend reversal : adaptative moving average 100
Type : Bullish
Timeframe : 1 hour
Bullish price crossover with Moving Average 100
Type : Bullish
Timeframe : 1 hour
Bullish price crossover with adaptative moving average 20
Type : Bullish
Timeframe : 1 hour
The technical indicators are bullish. There is still some doubt about the price increase.
But beware of excesses. The Central Indicators scanner currently detects this:
CCI indicator is overbought : over 100
Type : Neutral
Timeframe : 1 hour
Williams %R indicator is overbought : over -20
Type : Neutral
Timeframe : 1 hour
Price is back over the pivot point
Type : Bullish
Timeframe : 1 hour
Price is back under the pivot point
Type : Bearish
Timeframe : Weekly
Momentum indicator is back over 0
Type : Bullish
Timeframe : 1 hour
Central Patterns, the market scanner focusing on chart patterns, resistances and supports found these results:
Near resistance of channel
Type : Bearish
Timeframe : 1 hour
Near support of triangle
Type : Bullish
Timeframe : 1 hour
The Central Candlesticks scanner which studies Japanese candlesticks did not detect anything.
| S3 | S2 | S1 | Price | R1 | R2 | R3 | |
|---|---|---|---|---|---|---|---|
| ProTrendLines | 2.0700 | 2.0738 | 2.0786 | 2.0794 | 2.0840 | 2.0915 | 2.0949 |
| Change (%) | -0.45% | -0.27% | -0.04% | - | +0.22% | +0.58% | +0.75% |
| Change | -0.0094 | -0.0056 | -0.0008 | - | +0.0046 | +0.0121 | +0.0155 |
| Level | Intermediate | Intermediate | Minor | - | Intermediate | Minor | Major |
Pivot points can also be used to set your price objectives. Here is the price situation in relation to pivot points:
| Pivot points | S3 | S2 | S1 | PP | R1 | R2 | R3 |
|---|---|---|---|---|---|---|---|
| Standard | 2.0640 | 2.0687 | 2.0726 | 2.0773 | 2.0812 | 2.0859 | 2.0898 |
| Camarilla | 2.0742 | 2.0750 | 2.0758 | 2.0766 | 2.0774 | 2.0782 | 2.0790 |
| Woodie | 2.0637 | 2.0685 | 2.0723 | 2.0771 | 2.0809 | 2.0857 | 2.0895 |
| Fibonacci | 2.0687 | 2.0720 | 2.0740 | 2.0773 | 2.0806 | 2.0826 | 2.0859 |
| Pivot points | S3 | S2 | S1 | PP | R1 | R2 | R3 |
|---|---|---|---|---|---|---|---|
| Standard | 2.0434 | 2.0549 | 2.0684 | 2.0799 | 2.0934 | 2.1049 | 2.1184 |
| Camarilla | 2.0749 | 2.0772 | 2.0795 | 2.0818 | 2.0841 | 2.0864 | 2.0887 |
| Woodie | 2.0443 | 2.0554 | 2.0693 | 2.0804 | 2.0943 | 2.1054 | 2.1193 |
| Fibonacci | 2.0549 | 2.0645 | 2.0704 | 2.0799 | 2.0895 | 2.0954 | 2.1049 |
| Pivot points | S3 | S2 | S1 | PP | R1 | R2 | R3 |
|---|---|---|---|---|---|---|---|
| Standard | 1.9981 | 2.0178 | 2.0460 | 2.0657 | 2.0939 | 2.1136 | 2.1418 |
| Camarilla | 2.0611 | 2.0655 | 2.0699 | 2.0743 | 2.0787 | 2.0831 | 2.0875 |
| Woodie | 2.0025 | 2.0199 | 2.0504 | 2.0678 | 2.0983 | 2.1157 | 2.1462 |
| Fibonacci | 2.0178 | 2.0361 | 2.0474 | 2.0657 | 2.0840 | 2.0953 | 2.1136 |
Numerical data
The following is the status of the technical indicators and moving averages at the time of publication of this technical analysis:
| RSI (14): | 56.85 | |
| MACD (12,26,9): | 0.0000 | |
| Directional Movement: | 5.2388 | |
| AROON (14): | -28.5714 | |
| DEMA (21): | 2.0773 | |
| Parabolic SAR (0,02-0,02-0,2): | 2.0728 | |
| Elder Ray (13): | 0.0013 | |
| Super Trend (3,10): | 2.0813 | |
| Zig ZAG (10): | 2.0795 | |
| VORTEX (21): | 0.9811 | |
| Stochastique (14,3,5): | 76.26 | |
| TEMA (21): | 2.0774 | |
| Williams %R (14): | -4.11 | |
| Chande Momentum Oscillator (20): | 0.0012 | |
| Repulse (5,40,3): | 0.1486 | |
| ROCnROLL: | 1 | |
| TRIX (15,9): | -0.0017 | |
| Courbe Coppock: | 0.07 |
| MA7: | 2.0783 | |
| MA20: | 2.0670 | |
| MA50: | 2.0662 | |
| MA100: | 2.0610 | |
| MAexp7: | 2.0777 | |
| MAexp20: | 2.0774 | |
| MAexp50: | 2.0776 | |
| MAexp100: | 2.0776 | |
| Price / MA7: | +0.05% | |
| Price / MA20: | +0.60% | |
| Price / MA50: | +0.64% | |
| Price / MA100: | +0.89% | |
| Price / MAexp7: | +0.08% | |
| Price / MAexp20: | +0.10% | |
| Price / MAexp50: | +0.09% | |
| Price / MAexp100: | +0.09% |
News
The latest news and videos published on GBP/NZD at the time of the analysis were as follows:
-
 Why I'm looking to buy GBPNZD: Coleman
-
Why I'm looking to buy GBPNZD: Coleman
-
GBP/NZD: Pound Has Upperhand
-
Forex Trading Video: GBP/NZD The Cross Roads of BoE and RBNZ, Dollar Faces Wave of Data
-
Forex Strategy Video: Time Frame Matters on Entry from Themes Like Risk Trends to GBPNZD
About author

Online


Add a comment
Comments
0 comments on the analysis GBP/NZD - 1H