GBP/USD - GBP/USD Slipped Below 1.2200 Key Level - 01/09/2017 (GMT)
- Who voted?
- 385
- 0
- Timeframe : 4H

GBP/USD Chart
Are you looking for opportunities in indices and forex?
DISCOVER LONDINIA OPPORTUNITIES...
DISCOVER LONDINIA OPPORTUNITIES...
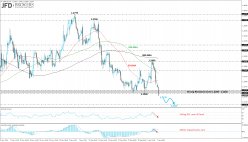
Sterling struggled throughout the first week of January against the U.S. dollar, despite that it failed to create a second positive week. The GBP/USD pair plunged more than 1.8% since Friday’s session and early this morning recorded a fresh two-month low at 1.2180 price level.
As you can see on the chart, the pair failed to break, or close, above the key resistance level at 1.2430 during the previous week while the currency pair rebounded on the latter level and started a significant bearish movement. The next level to watch would be the 1.2115 support barrier. On the short-term timeframe, the Relative Strength Index (RSI) is falling with strong momentum as it is approaching the oversold area. The MACD oscillator has just entered the negative territory while it lies below its trigger line.
As you can see on the chart, the pair failed to break, or close, above the key resistance level at 1.2430 during the previous week while the currency pair rebounded on the latter level and started a significant bearish movement. The next level to watch would be the 1.2115 support barrier. On the short-term timeframe, the Relative Strength Index (RSI) is falling with strong momentum as it is approaching the oversold area. The MACD oscillator has just entered the negative territory while it lies below its trigger line.
This member did not declare if he had a position on this financial instrument or a related financial instrument.
About author

Offline


Add a comment
Comments
0 comments on the analysis GBP/USD - 4H