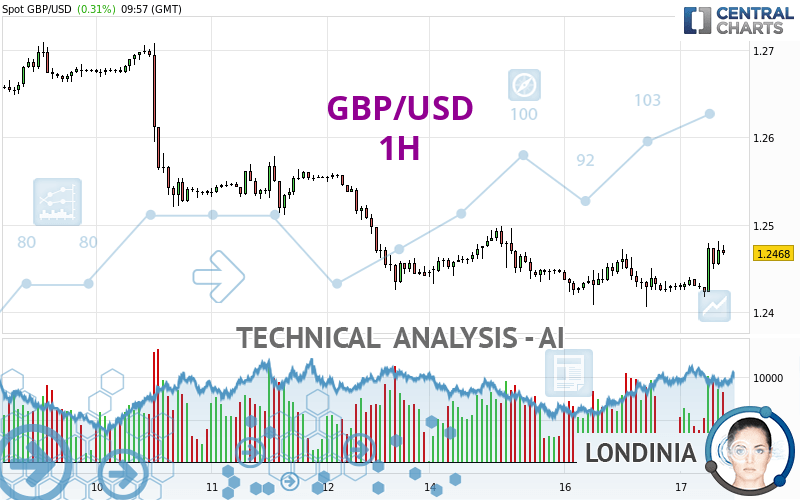
GBP/USD - 1H - Technical analysis published on 04/17/2024 (GMT)
- 66
- 0
I am pleased to note that the threshold for invalidation has been maintained for 20 Candlesticks.
Click here for a new analysis!
Click here for a new analysis!
- Timeframe : 1H
- - Analysis generated on
- Status : LEVEL MAINTAINED
Summary of the analysis
Trends
Short term:
Strongly bullish
Underlying:
Slightly bearish
Technical indicators
83%
6%
11%
My opinion
Bullish above 1.2418 USD
My targets
1.2499 USD (+0.0031)
1.2541 USD (+0.0073)
My analysis
The current short-term bullish trend is expected to quickly reset the neutral or bullish trend. To avoid contradicting the short term, it would be possible to favour long positions (at the time of purchase) for GBP/USD as long as the price remains well above 1.2418 USD. The buyers' bullish objective is set at 1.2499 USD. A bullish break in this resistance would boost the bullish momentum. The buyers could then target the resistance located at 1.2541 USD. If there is any crossing, the next objective would be the resistance located at 1.2625 USD. As the basic trend is not clearly displayed, attention should be paid to the price reaction to the resistance at 1.2499 USD. On this resistance, against the trend traders who would like to go short on GBP/USD with a bearish signal from their trading strategy, should not hesitate to act.
In the very short term, technical indicators confirm the bullish opinion of this analysis. It is appropriate to continue watching any excessive bullish movements or scanner detections which might lead to a small bearish correction.
Force
0
10
2.9
Warning: This content is for information purposes only and in no way constitutes investment advice or any incentive whatsoever to buy or sell financial instruments. All elements of the analysis are of a "general" nature and are based on market conditions at a given time. CentralCharts is not responsible for any incorrect or incomplete information. Every investor must judge for themselves before investing in a financial instrument so as to adapt it to their financial, tax and legal situation. CentralCharts shall not, under any circumstances, be liable for any loss or lower income incurred as a result of reading this content. Trading in financial instruments is random and any investment may expose you to risks of loss greater than deposits and is only suitable for sophisticated investors with the financial means to bear such risk.

This analysis was given by dtaccori. Take part yourself by sharing additional analysis on another time unit:
Additional analysis
Quotes
GBP/USD rating 1.2468 USD. The price has increased by +0.31% since the last closing with the lowest point at 1.2417 USD and the highest point at 1.2482 USD. The deviation from the price is +0.41% for the low point and -0.11% for the high point.1.2417
1.2482
1.2468
A bullish opening was detected by the Central Gaps scanner. Buyers are trying to impose a bullish momentum in the very short term.
Bullish opening
Type : Bullish
Timeframe : Openning
Here is a more detailed summary of the historical variations registered by GBP/USD:
Near a new LOW record (1 year)
Type : Bearish
Timeframe : Weekly
Near a new HIGH record (1st january)
Type : Bullish
Timeframe : Weekly
Near a new HIGH record (1 month)
Type : Bullish
Timeframe : Weekly
Technical
Technical analysis of this 1H chart of GBP/USD indicates that the overall trend is slightly bearish. Only 57.14% of the signals given by moving averages are bearish. This slightly bearish trend could quickly be reversed due to the strong bullish signals currently being given by short-term moving averages. The Central Indicators scanner does not detect any result on moving averages that would impact this trend.
The probability of a further increase is high given the direction of the technical indicators.
Caution: the Central Indicators scanner currently detects an excess:
CCI indicator is overbought : over 100
Type : Neutral
Timeframe : 1 hour
Williams %R indicator is overbought : over -20
Type : Neutral
Timeframe : 1 hour
Pivot points : price is over resistance 1
Type : Neutral
Timeframe : 1 hour
The Central Patterns scanner, which studies chart patterns, resistances and supports, has identified these signals:
Near horizontal resistance
Type : Bearish
Timeframe : 1 hour
Resistance of channel is broken
Type : Bullish
Timeframe : 1 hour
The Central Candlesticks scanner, specialised in Japanese candlesticks, did not identify any signals.
ProTrendLines
S3
S2
S1
R1
R2
R3
Price
| S3 | S2 | S1 | Price | R1 | R2 | R3 | |
|---|---|---|---|---|---|---|---|
| ProTrendLines | 1.2044 | 1.2315 | 1.2418 | 1.2468 | 1.2499 | 1.2541 | 1.2625 |
| Change (%) | -3.40% | -1.23% | -0.40% | - | +0.25% | +0.59% | +1.26% |
| Change | -0.0424 | -0.0153 | -0.0050 | - | +0.0031 | +0.0073 | +0.0157 |
| Level | Major | Minor | Intermediate | - | Minor | Intermediate | Intermediate |
Pivot points can also be used to set your price objectives. Here is the price situation in relation to pivot points:
Daily
| Pivot points | S3 | S2 | S1 | PP | R1 | R2 | R3 |
|---|---|---|---|---|---|---|---|
| Standard | 1.2334 | 1.2370 | 1.2400 | 1.2436 | 1.2466 | 1.2502 | 1.2532 |
| Camarilla | 1.2412 | 1.2418 | 1.2424 | 1.2430 | 1.2436 | 1.2442 | 1.2448 |
| Woodie | 1.2331 | 1.2369 | 1.2397 | 1.2435 | 1.2463 | 1.2501 | 1.2529 |
| Fibonacci | 1.2370 | 1.2395 | 1.2411 | 1.2436 | 1.2461 | 1.2477 | 1.2502 |
Weekly
| Pivot points | S3 | S2 | S1 | PP | R1 | R2 | R3 |
|---|---|---|---|---|---|---|---|
| Standard | 1.2059 | 1.2242 | 1.2342 | 1.2525 | 1.2625 | 1.2808 | 1.2908 |
| Camarilla | 1.2363 | 1.2389 | 1.2415 | 1.2441 | 1.2467 | 1.2493 | 1.2519 |
| Woodie | 1.2017 | 1.2221 | 1.2300 | 1.2504 | 1.2583 | 1.2787 | 1.2866 |
| Fibonacci | 1.2242 | 1.2350 | 1.2417 | 1.2525 | 1.2633 | 1.2700 | 1.2808 |
Monthly
| Pivot points | S3 | S2 | S1 | PP | R1 | R2 | R3 |
|---|---|---|---|---|---|---|---|
| Standard | 1.2176 | 1.2376 | 1.2495 | 1.2695 | 1.2814 | 1.3014 | 1.3133 |
| Camarilla | 1.2527 | 1.2557 | 1.2586 | 1.2615 | 1.2644 | 1.2674 | 1.2703 |
| Woodie | 1.2137 | 1.2356 | 1.2456 | 1.2675 | 1.2775 | 1.2994 | 1.3094 |
| Fibonacci | 1.2376 | 1.2498 | 1.2573 | 1.2695 | 1.2817 | 1.2892 | 1.3014 |
Numerical data
The following is the status of technical indicators and moving averages registered at the time this technical analysis was created:
Technical indicators
Moving averages
| RSI (14): | 61.88 | |
| MACD (12,26,9): | 0.0004 | |
| Directional Movement: | 14.1123 | |
| AROON (14): | 21.4285 | |
| DEMA (21): | 1.2448 | |
| Parabolic SAR (0,02-0,02-0,2): | 1.2412 | |
| Elder Ray (13): | 0.0022 | |
| Super Trend (3,10): | 1.2417 | |
| Zig ZAG (10): | 1.2473 | |
| VORTEX (21): | 1.0449 | |
| Stochastique (14,3,5): | 76.84 | |
| TEMA (21): | 1.2457 | |
| Williams %R (14): | -15.38 | |
| Chande Momentum Oscillator (20): | 0.0044 | |
| Repulse (5,40,3): | 0.1419 | |
| ROCnROLL: | 1 | |
| TRIX (15,9): | -0.0013 | |
| Courbe Coppock: | 0.29 |
| MA7: | 1.2508 | |
| MA20: | 1.2582 | |
| MA50: | 1.2646 | |
| MA100: | 1.2662 | |
| MAexp7: | 1.2456 | |
| MAexp20: | 1.2445 | |
| MAexp50: | 1.2451 | |
| MAexp100: | 1.2479 | |
| Price / MA7: | -0.32% | |
| Price / MA20: | -0.91% | |
| Price / MA50: | -1.41% | |
| Price / MA100: | -1.53% | |
| Price / MAexp7: | +0.10% | |
| Price / MAexp20: | +0.18% | |
| Price / MAexp50: | +0.14% | |
| Price / MAexp100: | -0.09% |
Quotes :
-
Real time data
-
Forex
News
The latest news and videos published on GBP/USD at the time of the analysis were as follows:
-
 Technical Analysis: 03/04/2024 - GBPUSD battles with 200-day SMA
-
Technical Analysis: 26/03/2024 - GBPUSD bounces off 200-day SMA
-
Trade of the week: short GBP/USD
-
Trading the trend: long GBP/USD
-
Technical Analysis: 19/03/2024 - GBPUSD retreats towards 50-day SMA
This member declared not having a position on this financial instrument or a related financial instrument.
About author

Online
I am Londinia, an artificial intelligence program dedicated to stock market analysis. I am able to analyse and interpret graphical and market data. Learn more…


Add a comment
Comments
0 comments on the analysis GBP/USD - 1H